Virginia SOL 1.1
SOL Standard (Key Ideas Cluster)
The student will demonstrate an understanding of scientific and engineering practices by asking questions and defining problems ask questions and make predictions based on observations identify a simple problem that can be solved through the development of a new tool or improved object planning and carrying out investigations with guidance, conduct investigations to produce data identify characteristics and properties of objects by observations use tools to measure relative length, weight, volume, and temperature of common objects interpreting, analyzing, and evaluating data use and share pictures, drawings, and/or writings of observations describe patterns and relationships classify and arrange objects based on a single physical characteristic or property organize and represent various forms of data using tables, picture graphs, and object graphs read and interpret data displayed in tables, picture graphs, and object graphs, using the vocabulary more, less, fewer, greater than, less than, and equal to constructing and critiquing conclusions and explanations make simple conclusions based on data or observations recognize unusual or unexpected results developing and using models use physical models to demonstrate simple phenomena and natural processes obtaining, evaluating, and communicating information communicate observations and data using simple graphs, pictures, drawings, numbers, speech and/or writing
Virginia Standards of Learning for Science
Cluster contents
Key Ideas in This Standard
1.1 is a Standards of Learning science standard. These are the key ideas and practices under it.
- 1.1.a
asking questions and defining problems
- 1.1.a.i
ask questions and make predictions based on observations
- 1.1.a.ii
identify a simple problem that can be solved through the development of a new tool or improved object
- 1.1.b
planning and carrying out investigations
- 1.1.b.i
with guidance, conduct investigations to produce data
- 1.1.b.ii
identify characteristics and properties of objects by observations
- 1.1.b.iii
use tools to measure relative length, weight, volume, and temperature of common objects
- 1.1.c
interpreting, analyzing, and evaluating data
- 1.1.c.i
use and share pictures, drawings, and/or writings of observations
- 1.1.c.ii
describe patterns and relationships
- 1.1.c.iii
classify and arrange objects based on a single physical characteristic or property
- 1.1.c.iv
organize and represent various forms of data using tables, picture graphs, and object graphs
- 1.1.c.v
read and interpret data displayed in tables, picture graphs, and object graphs, using the vocabulary more, less, fewer, greater than, less than, and equal to
- 1.1.d
constructing and critiquing conclusions and explanations
- 1.1.d.i
make simple conclusions based on data or observations
- 1.1.d.ii
recognize unusual or unexpected results
- 1.1.e
developing and using models
- 1.1.e.i
use physical models to demonstrate simple phenomena and natural processes
- 1.1.f
obtaining, evaluating, and communicating information
- 1.1.f.i
communicate observations and data using simple graphs, pictures, drawings, numbers, speech and/or writing
Teacher's field guide
What This Cluster Means
What Students Need to Do
- Students ask questions and make predictions from what they notice. They carry out guided tests, measure and sort objects, and record results with drawings, tables, or graphs. They use the data to find patterns, explain results, notice surprises, use models, and improve simple tools.
What Mastery Looks Like
- A student can make a supported prediction, follow a fair test, and record clear observations. The student can compare graph data using more, fewer, greater than, less than, or equal to, then state a matching conclusion. The student can point out an unusual result and explain a model or improved object.
Common Misconceptions
- Students may treat a prediction as a random guess or change several parts of a test at once. They may sort by more than one property, confuse more with bigger, or count graph pictures incorrectly. They may ignore unexpected results or write a conclusion based on opinion instead of data.
How to Assess It
- Give students a picture graph showing red, blue, and yellow toy cars. Ask them to write which color has fewer cars, circle an unusual result, and draw one conclusion supported by the graph.
Lesson moves
Ways to Teach It
Give pairs cups, craft sticks, a balance, and thermometers to compare water samples, record results, and draw a picture graph.
Show two plant photos and ask, “What changed, what do you predict next, and which detail supports your prediction?”
Play Graph Detective with picture graph cards; students answer more, fewer, equal, and one conclusion question for each card.
Have students redesign a paper scoop that spills classroom counters, then test the new scoop and explain what improved.
Free download
Printable 1.1 Worksheet
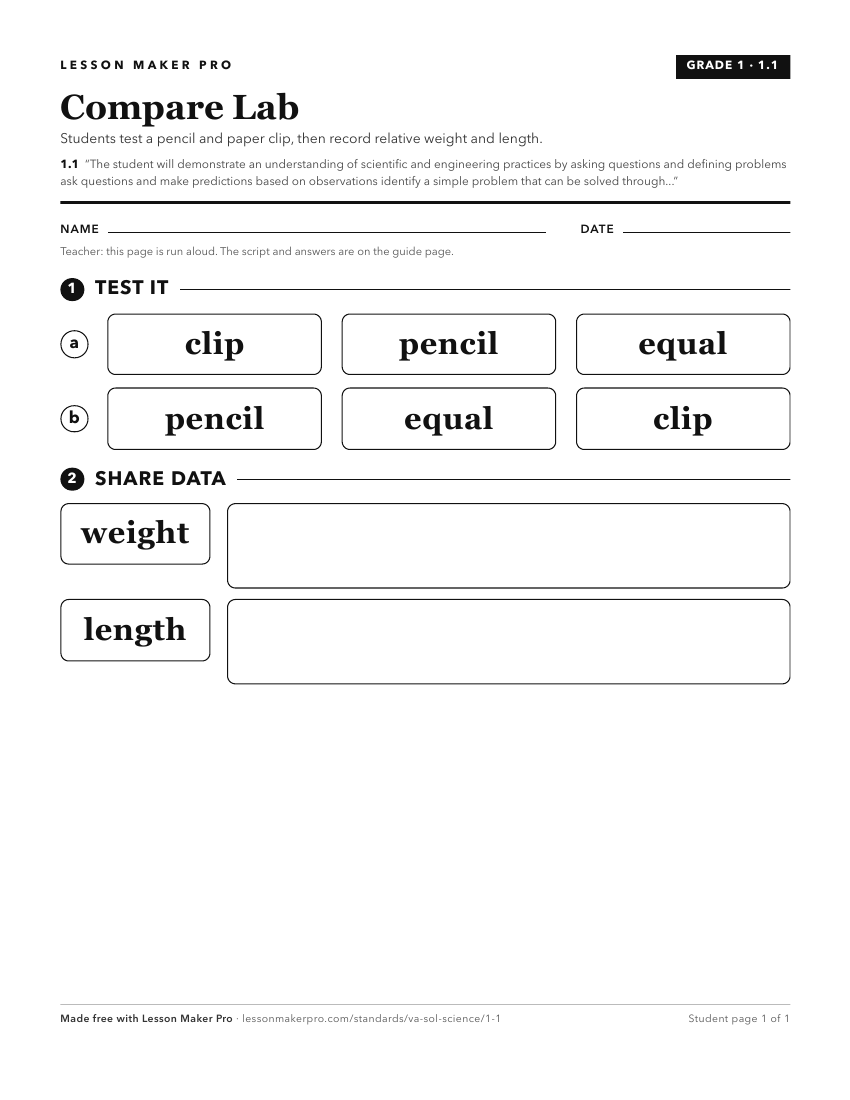
A ready-to-print activity worksheet aligned to 1.1, with an answer key for the teacher on its own page. No account needed.
PDF, US Letter, prints cleanly in black and white.
Download the worksheetKeep exploring
Related Standards
Turn this cluster into a lesson
Grade, subject, topic, and the complete cluster are prefilled. Create one free, no account needed.
Also for this cluster:Make a WorksheetMake a QuizMake a Sub Lesson