Virginia SOL 1.1.c.iv
The Standard
- 1.1
- The student will demonstrate an understanding of scientific and engineering practices by
interpreting, analyzing, and evaluating data organize and represent various forms of data using tables, picture graphs, and object graphs
Virginia Standards of Learning for Science · The student will demonstrate an understanding of scientific and engineering practices by
Teacher's field guide
What This Standard Means
What Students Need to Do
- Students sort observations or objects into clear groups and count each group. They show the same results in a table, picture graph, or object graph.
What Mastery Looks Like
- Students label groups, record correct totals, and place one picture or object for each item counted. They can use their display to identify more, fewer, equal, and total amounts.
Common Misconceptions
- Students may count objects twice, skip objects, or place them in the wrong group. They may leave off labels or draw pictures that do not match the recorded totals.
How to Assess It
- Give students data showing 3 cats, 5 dogs, and 2 fish. Ask them to make a labeled picture graph and circle the largest group.
Lesson moves
Ways to Teach It
Give pairs 15 colored buttons to sort, arrange as an object graph, and record in a table.
Show two picture graphs of the same data and ask, “Which is easier to read, and why?”
Play Graph Match by having students pair prepared data tables with the correct picture graphs.
Survey classmates about favorite playground equipment, then make a class picture graph using sticky notes.
Free download
Printable 1.1.c.iv Worksheet
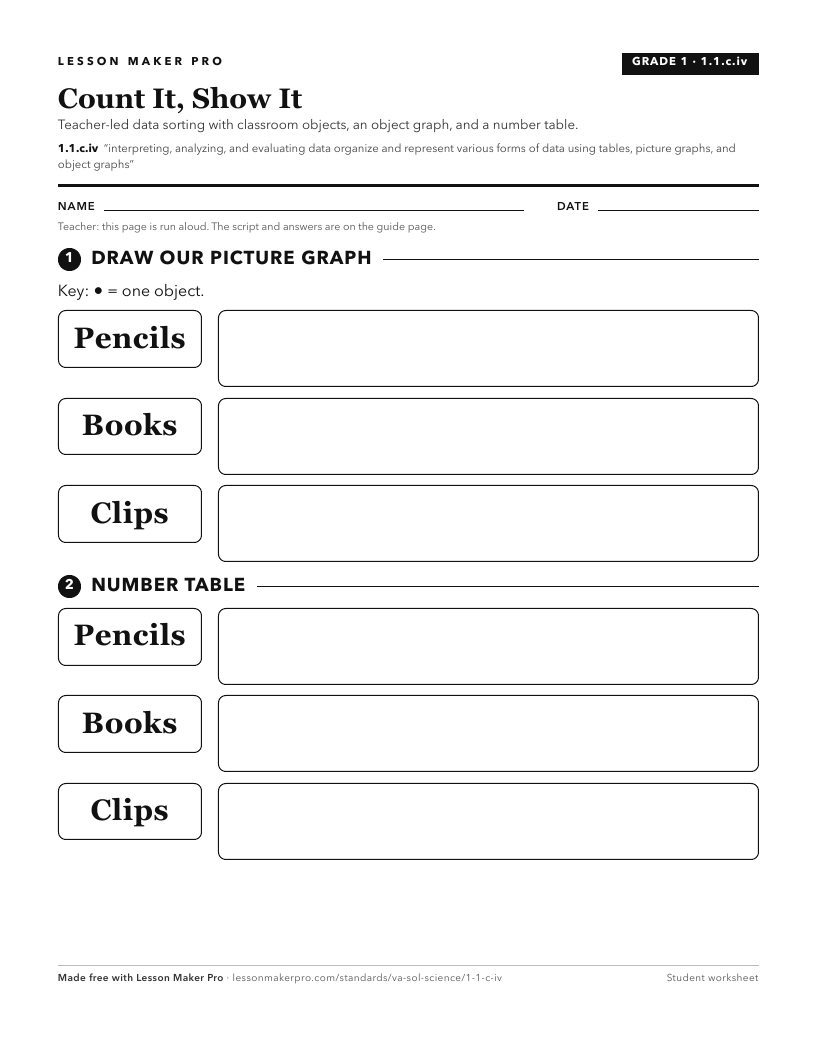
A ready-to-print activity worksheet aligned to 1.1.c.iv, with an answer key for the teacher on its own page. No account needed.
PDF, US Letter, prints cleanly in black and white.
Download the worksheetKeep exploring
Related Standards
Turn this exact standard into a lesson
Grade, subject, topic, and the complete standard are prefilled. Create one free, no account needed.
Also for this standard:Make a WorksheetMake a QuizMake a Sub Lesson