Virginia SOL 4.1.c.i
The Standard
- 4.1
- The student will demonstrate an understanding of scientific and engineering practices by
interpreting, analyzing, and evaluating data organize and represent data in bar graphs and line graphs
Virginia Standards of Learning for Science · The student will demonstrate an understanding of scientific and engineering practices by
Teacher's field guide
What This Standard Means
What Students Need to Do
- Students turn data tables into clear bar graphs or line graphs. They choose a graph type, set a consistent scale, label both axes, add a title, and plot values accurately.
What Mastery Looks Like
- Students use bar graphs to compare groups and line graphs to show change over time. Their graphs have accurate intervals, labels, titles, and plotted values that match the data.
Common Misconceptions
- Students may use a line graph for categories or space numbers unevenly along an axis. They may omit units, switch the axes, or draw bars with different widths.
How to Assess It
- Give students a small table showing daily temperatures for five days. Ask them to choose a graph type, create the graph, and explain their choice in one sentence.
Lesson moves
Ways to Teach It
Measure water temperature every two minutes for ten minutes, record the results, and make a labeled line graph.
Compare two graphs of the same data and write which graph communicates the pattern more clearly and why.
Run a graph sort relay where teams match data tables with bar graphs, line graphs, titles, and scales.
Survey classmates about favorite school lunch choices, tally the results, and create a bar graph for the cafeteria manager.
Free download
Printable 4.1.c.i Worksheet
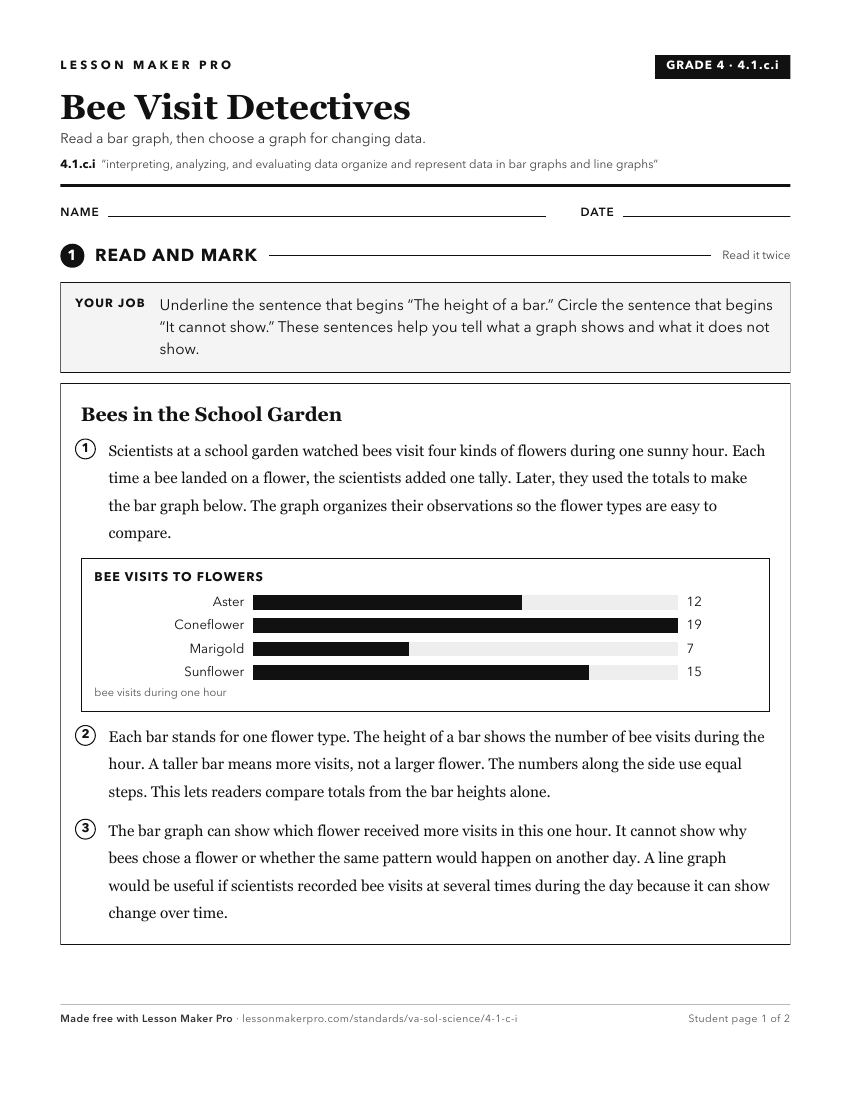
A ready-to-print activity worksheet aligned to 4.1.c.i, with an answer key for the teacher on its own page. No account needed.
PDF, US Letter, prints cleanly in black and white.
Download the worksheetKeep exploring
Related Standards
Turn this exact standard into a lesson
Grade, subject, topic, and the complete standard are prefilled. Create one free, no account needed.
Also for this standard:Make a WorksheetMake a QuizMake a Sub Lesson