Virginia SOL 2.1
SOL Standard (Key Ideas Cluster)
The student will demonstrate an understanding of scientific and engineering practices by asking questions and defining problems ask questions that can be investigated make predictions based on observations and prior experiences identify a simple problem that can be solved through the development of a new tool or improved object planning and carrying out investigations with guidance, plan and conduct simple investigations to produce data use appropriate tools to measure length, weight, and temperature of common objects using U.S. Customary units measure time intervals using proper tools interpreting, analyzing, and evaluating data organize and represent data in pictographs and bar graphs read and interpret data represented in pictographs and bar graphs constructing and critiquing conclusions and explanations make simple conclusions based on data or observations distinguish between opinion and evidence recognize unusual or unexpected results developing and using models use models to demonstrate simple phenomena and natural processes obtaining, evaluating, and communicating information communicate observations and data using simple graphs, drawings, numbers, speech, and/or writing
Virginia Standards of Learning for Science
Cluster contents
Key Ideas in This Standard
2.1 is a Standards of Learning science standard. These are the key ideas and practices under it.
- 2.1.a
asking questions and defining problems
- 2.1.a.i
ask questions that can be investigated
- 2.1.a.ii
make predictions based on observations and prior experiences
- 2.1.a.iii
identify a simple problem that can be solved through the development of a new tool or improved object
- 2.1.b
planning and carrying out investigations
- 2.1.b.i
with guidance, plan and conduct simple investigations to produce data
- 2.1.b.ii
use appropriate tools to measure length, weight, and temperature of common objects using U.S. Customary units
- 2.1.b.iii
measure time intervals using proper tools
- 2.1.c
interpreting, analyzing, and evaluating data
- 2.1.c.i
organize and represent data in pictographs and bar graphs
- 2.1.c.ii
read and interpret data represented in pictographs and bar graphs
- 2.1.d
constructing and critiquing conclusions and explanations
- 2.1.d.i
make simple conclusions based on data or observations
- 2.1.d.ii
distinguish between opinion and evidence
- 2.1.d.iii
recognize unusual or unexpected results
- 2.1.e
developing and using models
- 2.1.e.i
use models to demonstrate simple phenomena and natural processes
- 2.1.f
obtaining, evaluating, and communicating information
- 2.1.f.i
communicate observations and data using simple graphs, drawings, numbers, speech, and/or writing
Teacher's field guide
What This Cluster Means
What Students Need to Do
- Students turn observations into questions they can test and make predictions based on what they know. With guidance, they plan investigations, measure objects, record results, and make graphs. They use evidence, models, drawings, and words to explain results and improve simple objects.
What Mastery Looks Like
- Given a simple question, a student makes a sensible prediction, follows a plan, and records measurements with the correct tools and units. The student creates and reads a pictograph or bar graph, notices an unusual result, and states a conclusion supported by data. The student can also use a model and suggest a useful change to an object.
Common Misconceptions
- Students may ask questions that cannot be tested or treat a prediction as a random guess. They may mix up inches, ounces, degrees Fahrenheit, and minutes, or ignore the scale on a graph. They may present an opinion as evidence or remove an unexpected result without discussing it.
How to Assess It
- Give students these temperatures: Cup A, 62°F; Cup B, 64°F; Cup C, 81°F. Ask them to draw a bar graph, circle the unusual result, write one evidence-based conclusion, and pose one testable follow-up question.
Lesson moves
Ways to Teach It
At four stations, students measure a pencil in inches, an apple in ounces, water temperature in Fahrenheit, and a one-minute interval.
Show two seedling photos with heights listed, then ask, “Which claim uses evidence, and what data supports it?”
Play Graph Match by pairing data cards with bar graphs, pictographs, conclusions, and cards showing an unusual result.
Students redesign a paper crayon tray, test how many crayons it carries, and revise weak handles or sides.
Free download
Printable 2.1 Worksheet
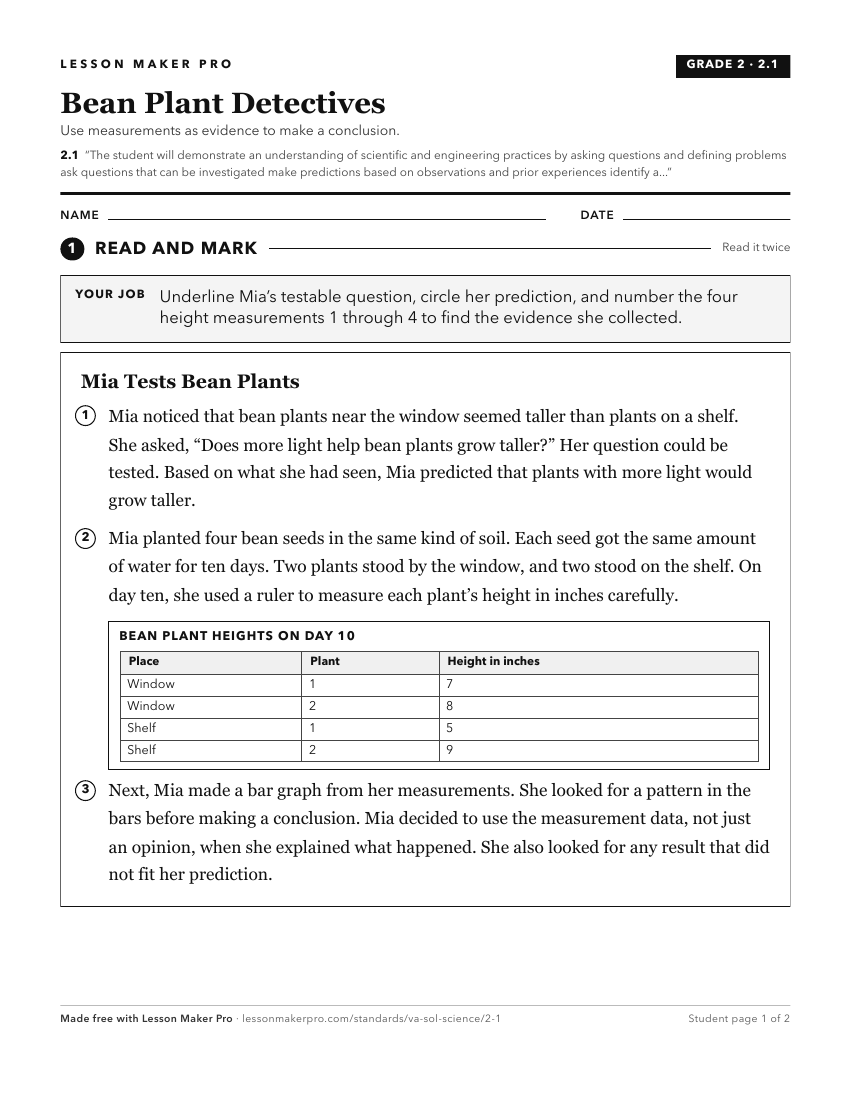
A ready-to-print activity worksheet aligned to 2.1, with an answer key for the teacher on its own page. No account needed.
PDF, US Letter, prints cleanly in black and white.
Download the worksheetKeep exploring
Related Standards
Turn this cluster into a lesson
Grade, subject, topic, and the complete cluster are prefilled. Create one free, no account needed.
Also for this cluster:Make a WorksheetMake a QuizMake a Sub Lesson