TEKS Math 7.6
Knowledge and Skills Statement (Standard Cluster)
The student applies mathematical process standards to use probability and statistics to describe or solve problems involving proportional relationships
Texas Essential Knowledge and Skills for Mathematics
Cluster contents
Student Expectations in This Statement
7.6 is a knowledge and skills statement. These are the student expectations under it.
- 7.6.A
represent sample spaces for simple and compound events using lists and tree diagrams
- 7.6.B
select and use different simulations to represent simple and compound events with and without technology
- 7.6.C
make predictions and determine solutions using experimental data for simple and compound events
- 7.6.D
make predictions and determine solutions using theoretical probability for simple and compound events
- 7.6.E
find the probabilities of a simple event and its complement and describe the relationship between the two
- 7.6.F
use data from a random sample to make inferences about a population
- 7.6.G
solve problems using data represented in bar graphs, dot plots, and circle graphs, including part-to-whole and part-to-part comparisons and equivalents
- 7.6.H
solve problems using qualitative and quantitative predictions and comparisons from simple experiments
- 7.6.I
determine experimental and theoretical probabilities related to simple and compound events using data and sample spaces.
Teacher's field guide
What This Cluster Means
What Students Need to Do
- Students list outcomes and draw tree diagrams for simple and compound events. They use simulations, experimental results, and theoretical probability to make predictions and compare an event with its complement. They use random samples and graphs to make claims about populations and solve part-to-part and part-to-whole problems.
What Mastery Looks Like
- A student can build a complete sample space, calculate simple and compound probabilities, and explain why an event and its complement total 1. Given trial data, the student predicts future results and compares experimental probability with theoretical probability. The student reads graphs and uses a random sample to support a reasonable population estimate.
Common Misconceptions
- Students often omit outcomes in compound sample spaces or assume all outcomes are equally likely. They may add probabilities when they should multiply, confuse experimental and theoretical probability, or forget that complement probabilities sum to 1. They may use biased samples or confuse part-to-part ratios with part-to-whole fractions.
How to Assess It
- Exit ticket: A fair spinner numbered 1, 2, and 3 is spun with a fair coin 30 times, and “odd and heads” occurs 11 times. Students list the six outcomes, find theoretical and experimental probabilities, find the theoretical probability of the complement, and predict occurrences in 120 trials.
Lesson moves
Ways to Teach It
Pairs flip two coins 50 times, tally outcomes, draw a tree diagram, and compare experimental probabilities with the theoretical sample space.
Ask students to write whether 30 randomly selected students can represent schoolwide opinion, then defend their answer.
Play probability match: students pair event cards with sample spaces, theoretical probabilities, complements, and simulation results posted around the room.
Give a circle graph of a family budget and have students calculate category amounts, part-to-part ratios, and part-to-whole percentages.
Free download
Printable 7.6 Worksheet
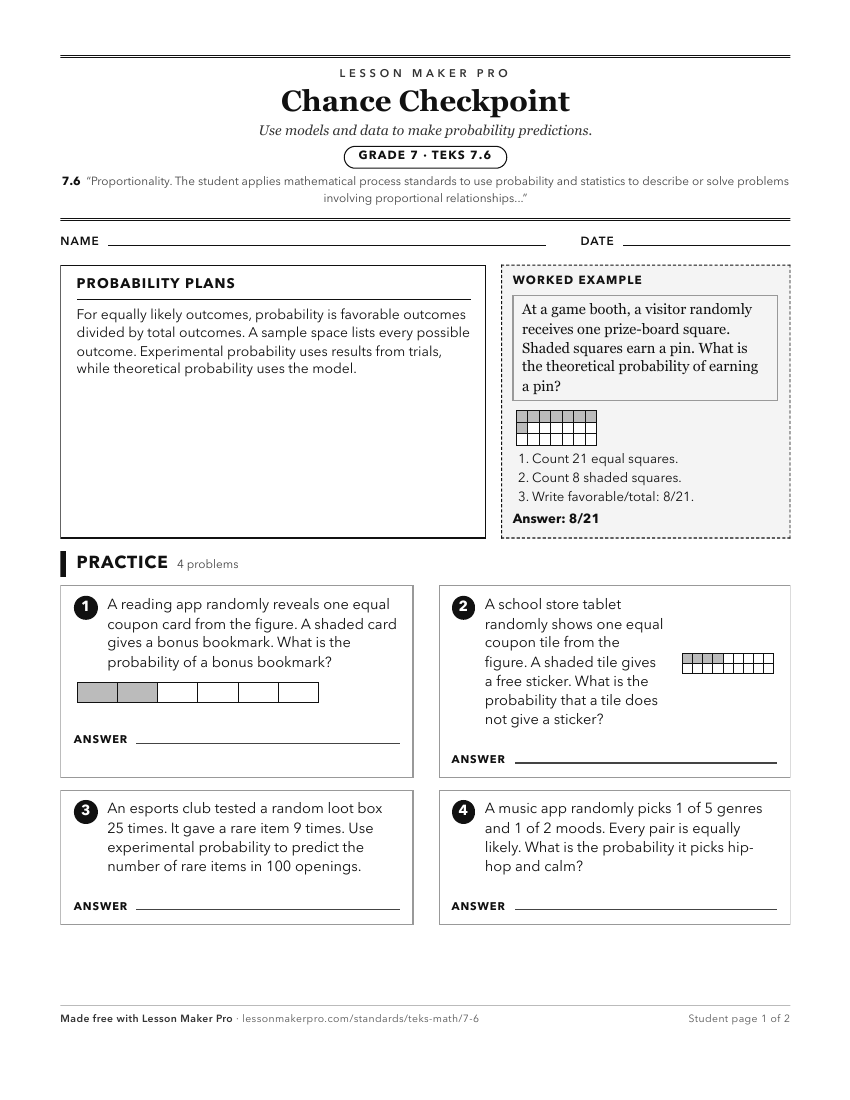
A ready-to-print activity worksheet aligned to 7.6, with an answer key for the teacher on its own page. No account needed.
PDF, US Letter, prints cleanly in black and white.
Download the worksheetKeep exploring
Related Standards
- 7.4
The student applies mathematical process standards to represent and solve problems involving proportional relationships
- 7.5
The student applies mathematical process standards to use geometry to describe or solve problems involving proportional relationships
- 6.5
The student applies mathematical process standards to solve problems involving proportional relationships
- 6.4
The student applies mathematical process standards to develop an understanding of proportional relationships in problem situations
Turn this cluster into a lesson
Grade, subject, topic, and the complete cluster are prefilled. Create one free, no account needed.
Also for this cluster:Make a WorksheetMake a QuizMake a Sub Lesson