TEKS Math 7.6.G
The Standard
solve problems using data represented in bar graphs, dot plots, and circle graphs, including part-to-whole and part-to-part comparisons and equivalents
Texas Essential Knowledge and Skills for Mathematics
Teacher's field guide
What This Standard Means
What Students Need to Do
- Students read category values from bar graphs, dot plots, and circle graphs, paying attention to scales and totals. They compare one category with the whole or with another category and write equivalent ratios, fractions, decimals, or percents.
What Mastery Looks Like
- Students identify the correct values, account for the graph's scale, and choose whether to compare a part with the whole or another part. They express equivalent comparisons as ratios, fractions, decimals, or percents and explain their reasoning.
Common Misconceptions
- Students may compare a category with the total when the question asks for a comparison between two categories. They may also read graph scales incorrectly or assume equal-looking sectors represent equal values.
How to Assess It
- Give students a circle graph showing 12 walkers, 8 bus riders, and 5 car riders. Ask for the walker-to-total and walker-to-bus comparisons in two equivalent forms.
Lesson moves
Ways to Teach It
Give groups counters and category cards, then have them build a dot plot and calculate two part-to-part and two part-to-whole comparisons.
Display a circle graph and ask, "Which two categories have the greatest ratio, and how can you prove it?"
Play Graph Match by having students pair bar graphs, dot plots, and circle graphs that show equivalent category comparisons.
Use class transportation data to create a graph, then compare bus riders with car riders and with the whole class.
Free download
Printable 7.6.G Worksheet
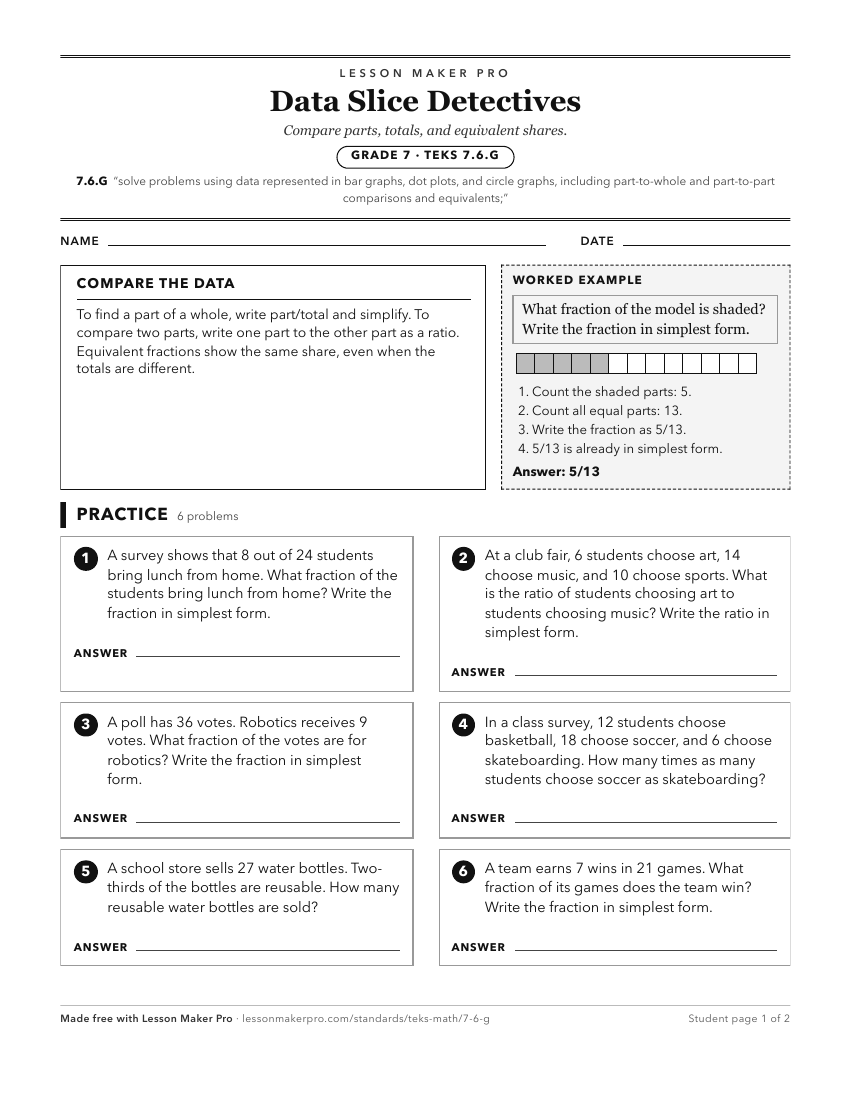
A ready-to-print activity worksheet aligned to 7.6.G, with an answer key for the teacher on its own page. No account needed.
PDF, US Letter, prints cleanly in black and white.
Download the worksheetKeep exploring
Related Standards
- 5.9.C
solve one- and two-step problems using data from a frequency table, dot plot, bar graph, stem-and-leaf plot, or scatterplot
- 3.8.B
solve one- and two-step problems using categorical data represented with a frequency table, dot plot, pictograph, or bar graph with scaled intervals
- 5.9.A
represent categorical data with bar graphs or frequency tables and numerical data, including data sets of measurements in fractions or decimals, with dot plots ...
- 4.9.B
solve one- and two-step problems using data in whole number, decimal, and fraction form in a frequency table, dot plot, or stem-and-leaf plot
Turn this exact standard into a lesson
Grade, subject, topic, and the complete standard are prefilled. Create one free, no account needed.
Also for this standard:Make a WorksheetMake a QuizMake a Sub Lesson