TEKS Math 3.8.B
The Standard
solve one- and two-step problems using categorical data represented with a frequency table, dot plot, pictograph, or bar graph with scaled intervals
Texas Essential Knowledge and Skills for Mathematics
Teacher's field guide
What This Standard Means
What Students Need to Do
- Students read category values from frequency tables, dot plots, pictographs, and bar graphs. They use the scale or key, then add or subtract values to answer questions that require one or two steps.
What Mastery Looks Like
- Students find accurate values in each type of display, including displays with scaled intervals or pictograph keys. They select the needed operations, complete both steps, and label the answer clearly.
Common Misconceptions
- Students may count grid lines or pictures instead of using the graph's scale or key. They may confuse category names with frequencies, choose the wrong operation, or stop after the first step.
How to Assess It
- Show a bar graph with intervals of 2 and values of 8 apples, 6 bananas, and 4 oranges. Ask, "How many more apples and bananas are there together than oranges? Show both steps."
Lesson moves
Ways to Teach It
Have pairs sort a bag of colored tiles, make a frequency table, and answer two comparison questions.
Display a pictograph with a key of 2 and ask, "How did the key change your calculation?"
Play Graph Detective: teams draw question cards, solve from four posted data displays, and earn a point by explaining both steps.
Use cafeteria fruit-choice data to calculate how many more pieces of the two most popular fruits are needed than the least popular fruit.
Free download
Printable 3.8.B Worksheet
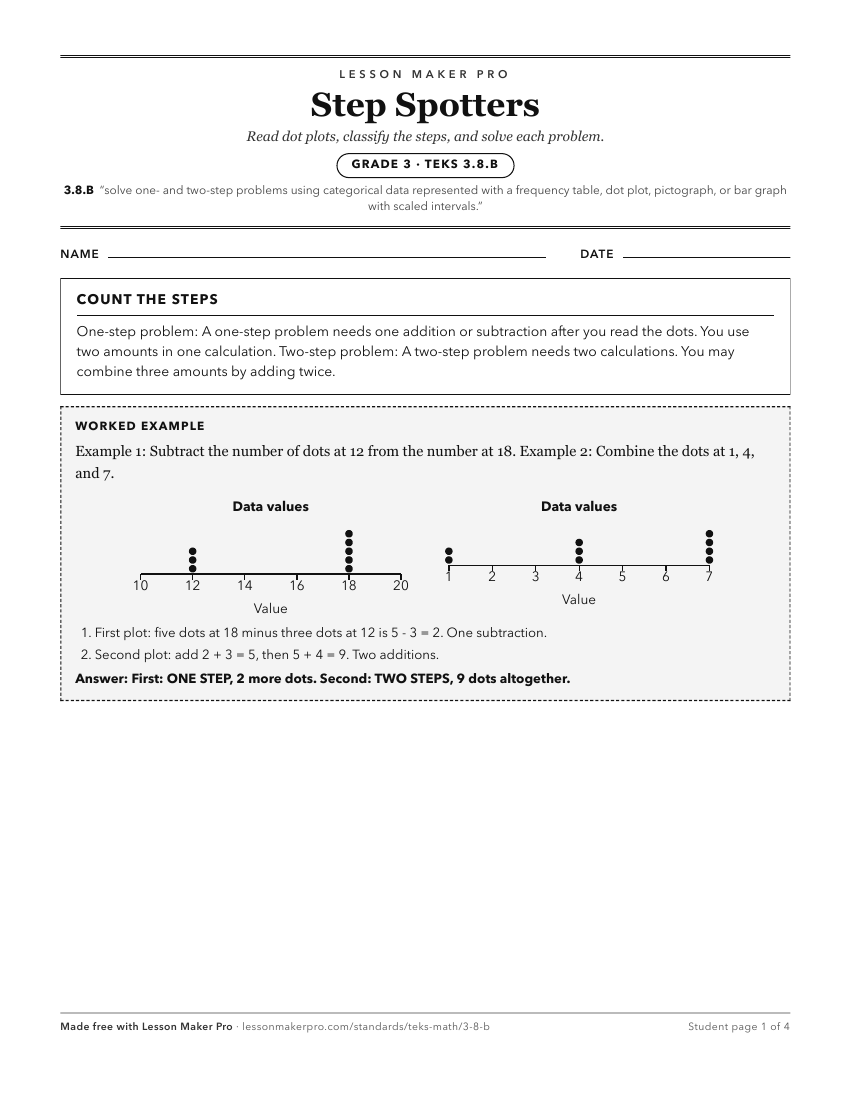
A ready-to-print activity worksheet aligned to 3.8.B, with an answer key for the teacher on its own page. No account needed.
PDF, US Letter, prints cleanly in black and white.
Download the worksheetKeep exploring
Related Standards
- 5.9.C
solve one- and two-step problems using data from a frequency table, dot plot, bar graph, stem-and-leaf plot, or scatterplot
- 5.9.A
represent categorical data with bar graphs or frequency tables and numerical data, including data sets of measurements in fractions or decimals, with dot plots ...
- 4.9.B
solve one- and two-step problems using data in whole number, decimal, and fraction form in a frequency table, dot plot, or stem-and-leaf plot
- 3.8.A
summarize a data set with multiple categories using a frequency table, dot plot, pictograph, or bar graph with scaled intervals
Turn this exact standard into a lesson
Grade, subject, topic, and the complete standard are prefilled. Create one free, no account needed.
Also for this standard:Make a WorksheetMake a QuizMake a Sub Lesson