TEKS Math 4.9.B
The Standard
solve one- and two-step problems using data in whole number, decimal, and fraction form in a frequency table, dot plot, or stem-and-leaf plot
Texas Essential Knowledge and Skills for Mathematics
Teacher's field guide
What This Standard Means
What Students Need to Do
- Students locate values and frequencies in different data displays. They combine, compare, or subtract those values to answer questions that require one or two calculations.
What Mastery Looks Like
- A student identifies the needed values, chooses the correct operations, and shows each calculation. The final answer includes a label and makes sense with the display.
Common Misconceptions
- Students may confuse a data value with its frequency or count stem digits and leaf digits separately. They may use only one category when a question requires combining categories before comparing.
How to Assess It
- Exit ticket: Show values 0.5, 1.0, and 1.5 with frequencies 3, 2, and 1. Ask, "How many more measurements are below 1.5 than equal to 1.5? Show two steps."
Lesson moves
Ways to Teach It
Give groups fraction cards for eight students, then have them build a floor dot plot and answer two comparison questions.
Display a stem-and-leaf plot and ask, "Which values answer the question, and why are they the right values?"
Play Data Detective: teams draw a question card, solve it from one display, and earn a point only when both steps are labeled.
Use a class survey of daily reading minutes to make a frequency table, then compare totals for two time ranges.
Free download
Printable 4.9.B Worksheet
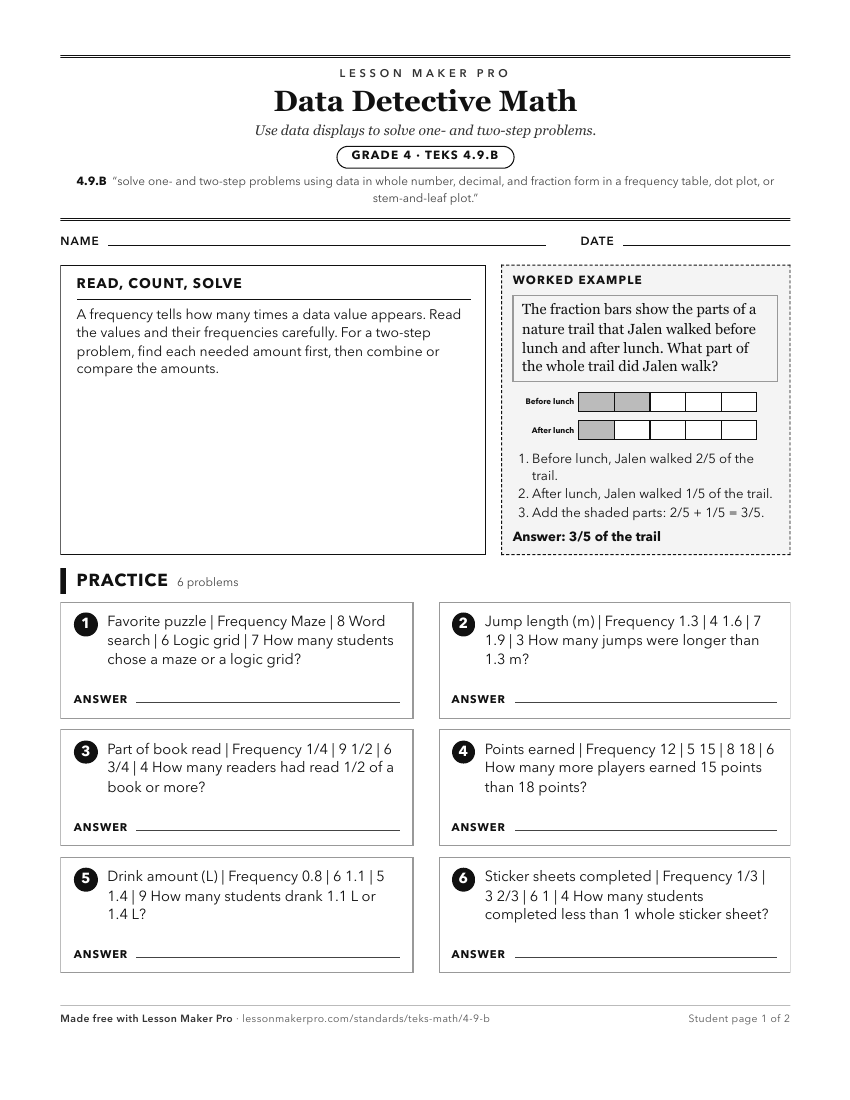
A ready-to-print activity worksheet aligned to 4.9.B, with an answer key for the teacher on its own page. No account needed.
PDF, US Letter, prints cleanly in black and white.
Download the worksheetKeep exploring
Related Standards
- 5.9.C
solve one- and two-step problems using data from a frequency table, dot plot, bar graph, stem-and-leaf plot, or scatterplot
- 3.8.B
solve one- and two-step problems using categorical data represented with a frequency table, dot plot, pictograph, or bar graph with scaled intervals
- 4.9.A
represent data on a frequency table, dot plot, or stem-and-leaf plot marked with whole numbers and fractions
- 7.6.G
solve problems using data represented in bar graphs, dot plots, and circle graphs, including part-to-whole and part-to-part comparisons and equivalents;
Turn this exact standard into a lesson
Grade, subject, topic, and the complete standard are prefilled. Create one free, no account needed.
Also for this standard:Make a WorksheetMake a QuizMake a Sub Lesson