TEKS Math 4.9.A
The Standard
represent data on a frequency table, dot plot, or stem-and-leaf plot marked with whole numbers and fractions
Texas Essential Knowledge and Skills for Mathematics
Teacher's field guide
What This Standard Means
What Students Need to Do
- Students take a list of whole-number or fractional data and organize it in a frequency table, dot plot, or stem-and-leaf plot. They choose accurate intervals and include labels that make the display readable.
What Mastery Looks Like
- Students organize a data set and show every value accurately in the requested display. They use equal intervals, stack dots correctly, order leaves, and include clear labels or a key.
Common Misconceptions
- Students may count a repeated value only once instead of recording its full frequency. They may space fractions unevenly, misalign stems and leaves, or forget titles, labels, and keys.
How to Assess It
- Give students the data set 1, 1 1/2, 2, 2, 2 1/2, 2 1/2, 3. Ask them to make a labeled frequency table and dot plot.
Lesson moves
Ways to Teach It
Have pairs measure eight classroom objects to the nearest half inch, then record the results in a frequency table and dot plot.
Ask students to compare a dot plot and frequency table made from the same data, then write which display shows repeated values more clearly.
Play Data Display Relay, where teams draw a data card and correctly add its value to a frequency table, dot plot, or stem-and-leaf plot.
Use weekly rainfall amounts marked in quarter inches, and have students create a display that helps a gardener compare the measurements.
Free download
Printable 4.9.A Worksheet
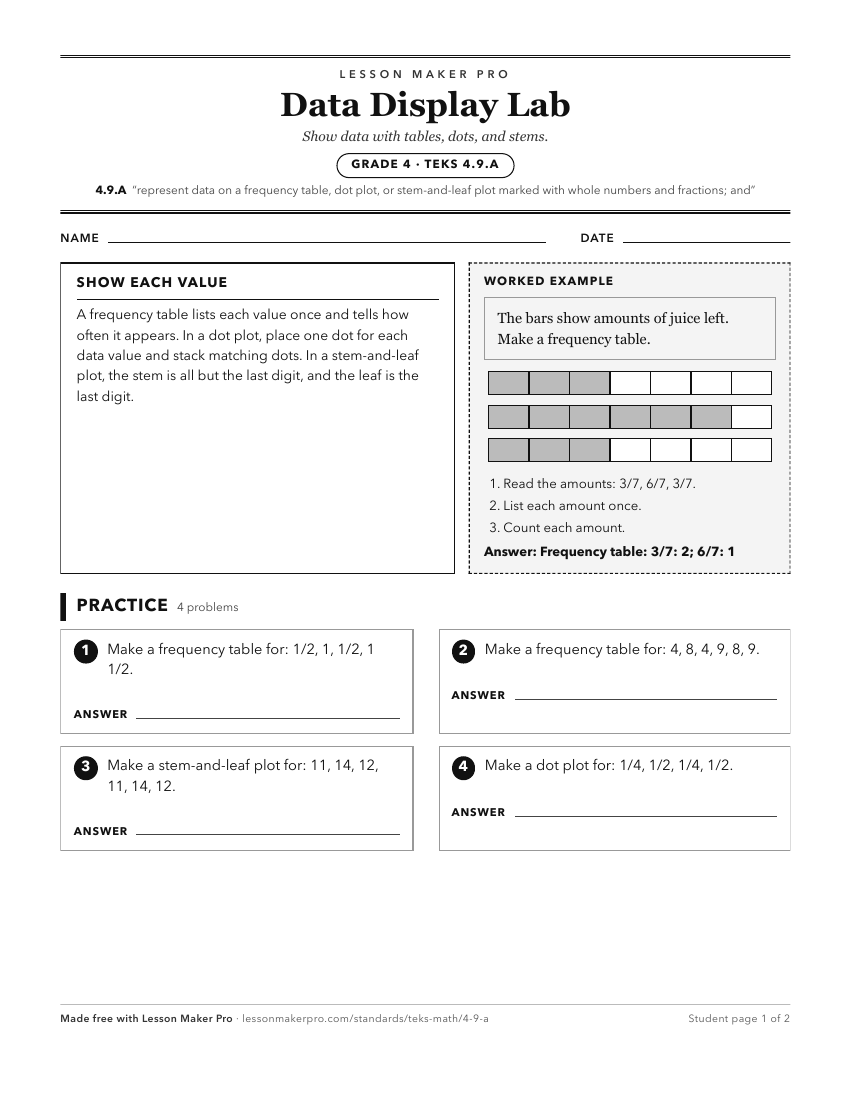
A ready-to-print activity worksheet aligned to 4.9.A, with an answer key for the teacher on its own page. No account needed.
PDF, US Letter, prints cleanly in black and white.
Download the worksheetKeep exploring
Related Standards
- 5.9.A
represent categorical data with bar graphs or frequency tables and numerical data, including data sets of measurements in fractions or decimals, with dot plots ...
- 4.9.B
solve one- and two-step problems using data in whole number, decimal, and fraction form in a frequency table, dot plot, or stem-and-leaf plot
- 6.12.A
represent numeric data graphically, including dot plots, stem-and-leaf plots, histograms, and box plots
- 6.13.A
interpret numeric data summarized in dot plots, stem-and-leaf plots, histograms, and box plots
Turn this exact standard into a lesson
Grade, subject, topic, and the complete standard are prefilled. Create one free, no account needed.
Also for this standard:Make a WorksheetMake a QuizMake a Sub Lesson