TEKS Math 6.12.A
The Standard
represent numeric data graphically, including dot plots, stem-and-leaf plots, histograms, and box plots
Texas Essential Knowledge and Skills for Mathematics
Teacher's field guide
What This Standard Means
What Students Need to Do
- Students organize a set of numbers and show the data in several graph forms. They select intervals, scales, labels, and keys that fit the data and plot each value accurately.
What Mastery Looks Like
- Students choose a suitable display, use an accurate scale, and include clear labels or a key. They plot every value correctly and can use the graph to describe the distribution.
Common Misconceptions
- Students may treat each histogram bar as one data value or leave gaps between bars. They may misuse the stem-and-leaf key, order values incorrectly, or place box plot points without finding the five-number summary.
How to Assess It
- Give students the data set 3, 4, 4, 6, 7, 8, 8, 9, 10, 11. Ask them to create a dot plot and explain what each dot shows.
Lesson moves
Ways to Teach It
Give pairs number cards and sticky dots, then have them build a floor dot plot and check that every card appears once.
Show two displays of the same data and ask, "Which display makes the spread easiest to see, and why?"
Run a graph sort relay where teams match data sets with their correct dot plots, stem-and-leaf plots, histograms, and box plots.
Collect classmates’ daily screen-time data, choose intervals, and create a histogram that could be shared with the class.
Free download
Printable 6.12.A Worksheet
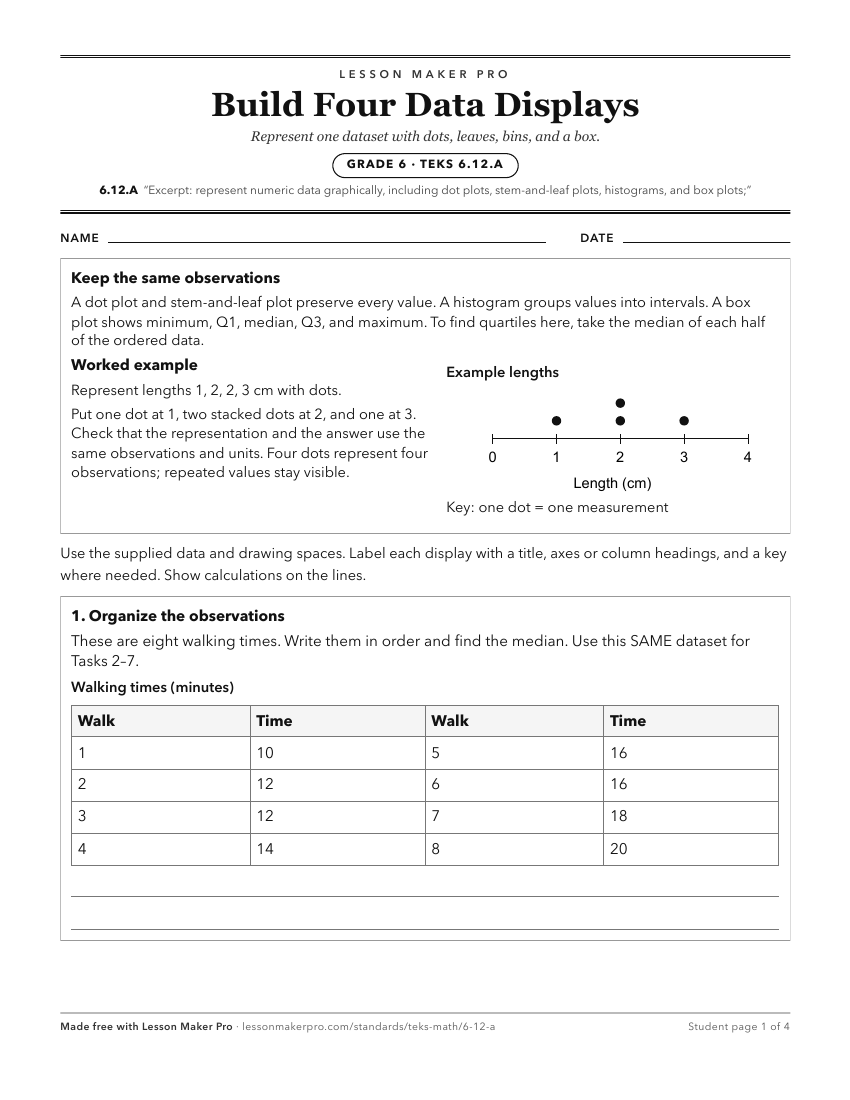
A ready-to-print activity worksheet aligned to 6.12.A, with an answer key for the teacher on its own page. No account needed.
PDF, US Letter, prints cleanly in black and white.
Download the worksheetKeep exploring
Related Standards
- 6.12.B
use the graphical representation of numeric data to describe the center, spread, and shape of the data distribution
- 5.9.A
represent categorical data with bar graphs or frequency tables and numerical data, including data sets of measurements in fractions or decimals, with dot plots ...
- 4.9.A
represent data on a frequency table, dot plot, or stem-and-leaf plot marked with whole numbers and fractions
- 6.13.A
interpret numeric data summarized in dot plots, stem-and-leaf plots, histograms, and box plots
Turn this exact standard into a lesson
Grade, subject, topic, and the complete standard are prefilled. Create one free, no account needed.
Also for this standard:Make a WorksheetMake a QuizMake a Sub Lesson