TEKS Math 6.13.A
The Standard
interpret numeric data summarized in dot plots, stem-and-leaf plots, histograms, and box plots
Texas Essential Knowledge and Skills for Mathematics
Teacher's field guide
What This Standard Means
What Students Need to Do
- Students read values and describe patterns shown in four common data displays. They use the graph’s scale and structure to explain center, spread, frequency, gaps, clusters, and outliers.
What Mastery Looks Like
- Students accurately find frequencies, medians, quartiles, ranges, clusters, gaps, and possible outliers when the graph provides that information. They use specific values to compare data sets and explain patterns.
Common Misconceptions
- Students may treat histogram bars as single values instead of intervals. They may misread place value in a stem-and-leaf plot or think a box plot shows every data value. They also confuse range with interquartile range.
How to Assess It
- Give students one histogram and one box plot. Ask them to identify the median or most frequent interval, describe the spread, and support one observation with numbers.
Lesson moves
Ways to Teach It
Have students place sticky notes on a floor number line to build a class dot plot, then identify clusters, gaps, and outliers.
Show two data displays and ask, "Which group is more consistent, and what evidence from the graphs supports your answer?"
Prepare matching cards with data sets, displays, and interpretation statements, then have teams race to form correct sets.
Use weekly temperature data to create a histogram and box plot, then discuss what each display reveals about the weather.
Free download
Printable 6.13.A Worksheet
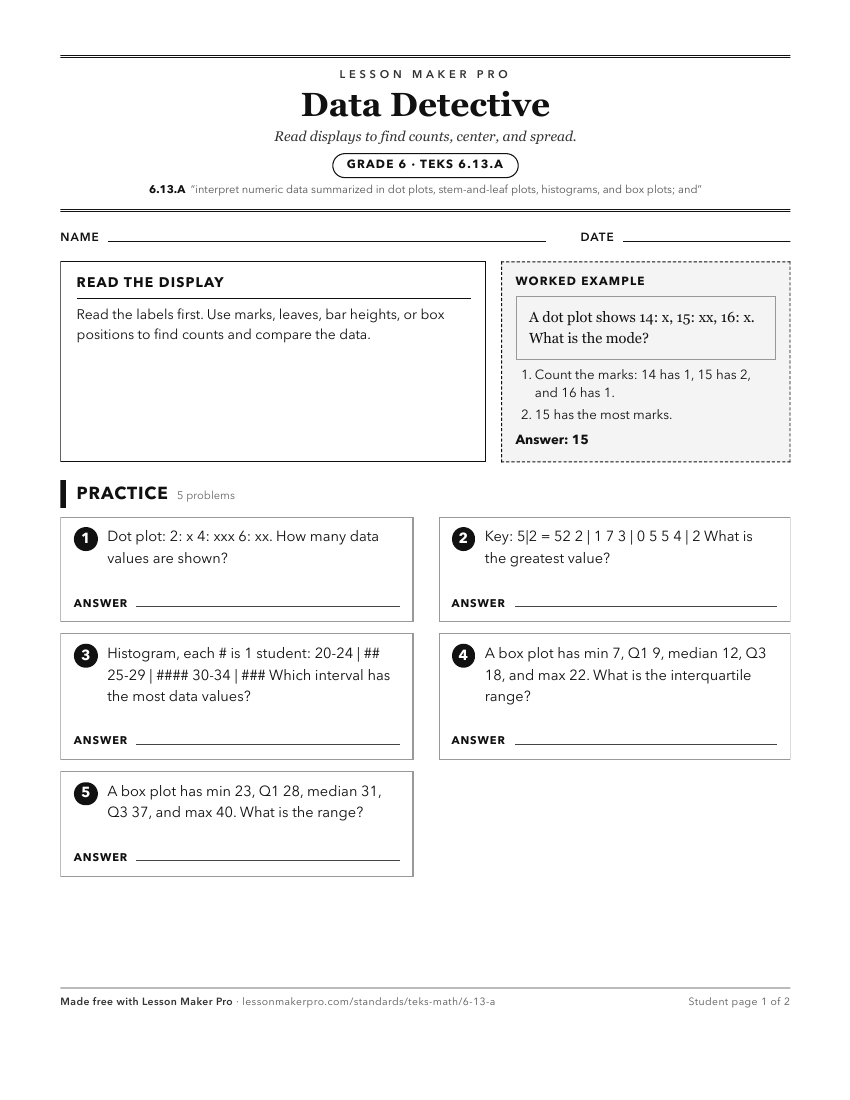
A ready-to-print activity worksheet aligned to 6.13.A, with an answer key for the teacher on its own page. No account needed.
PDF, US Letter, prints cleanly in black and white.
Download the worksheetKeep exploring
Related Standards
- 5.9.A
represent categorical data with bar graphs or frequency tables and numerical data, including data sets of measurements in fractions or decimals, with dot plots ...
- 4.9.A
represent data on a frequency table, dot plot, or stem-and-leaf plot marked with whole numbers and fractions
- 7.12.A
compare two groups of numeric data using comparative dot plots or box plots by comparing their shapes, centers, and spreads
- 6.12.A
represent numeric data graphically, including dot plots, stem-and-leaf plots, histograms, and box plots
Turn this exact standard into a lesson
Grade, subject, topic, and the complete standard are prefilled. Create one free, no account needed.
Also for this standard:Make a WorksheetMake a QuizMake a Sub Lesson