TEKS Math 5.9.A
The Standard
represent categorical data with bar graphs or frequency tables and numerical data, including data sets of measurements in fractions or decimals, with dot plots or stem-and-leaf plots
Texas Essential Knowledge and Skills for Mathematics
Teacher's field guide
What This Standard Means
What Students Need to Do
- Students organize category data in frequency tables or bar graphs. They display numerical measurements, including fractions and decimals, on dot plots or stem and leaf plots. They select a display that matches the data type.
What Mastery Looks Like
- Students choose a display that fits the type of data. Their graphs and tables include correct labels, even numerical scales, and one mark or count for every data value.
Common Misconceptions
- Students may use a bar graph for measurements instead of categories. They may treat 2.5 and 2.50 as different values, space number scales unevenly, or misread place value in a stem and leaf plot.
How to Assess It
- Give students the data 1.2, 1.5, 1.2, 1.8, 1.5, and 1.2. Ask them to make a labeled dot plot with an even scale.
Lesson moves
Ways to Teach It
Have pairs measure ten pencils to the nearest tenth of a centimeter, then build a class dot plot with sticky notes.
Ask students to explain in writing why favorite lunch choices need a bar graph while pencil lengths need a dot plot.
Give teams data cards to sort into categories, whole numbers, fractions, and decimals, then match each set to a suitable display.
Survey classroom snack preferences and record a frequency table, then graph the results as a bar graph for a class decision.
Free download
Printable 5.9.A Worksheet
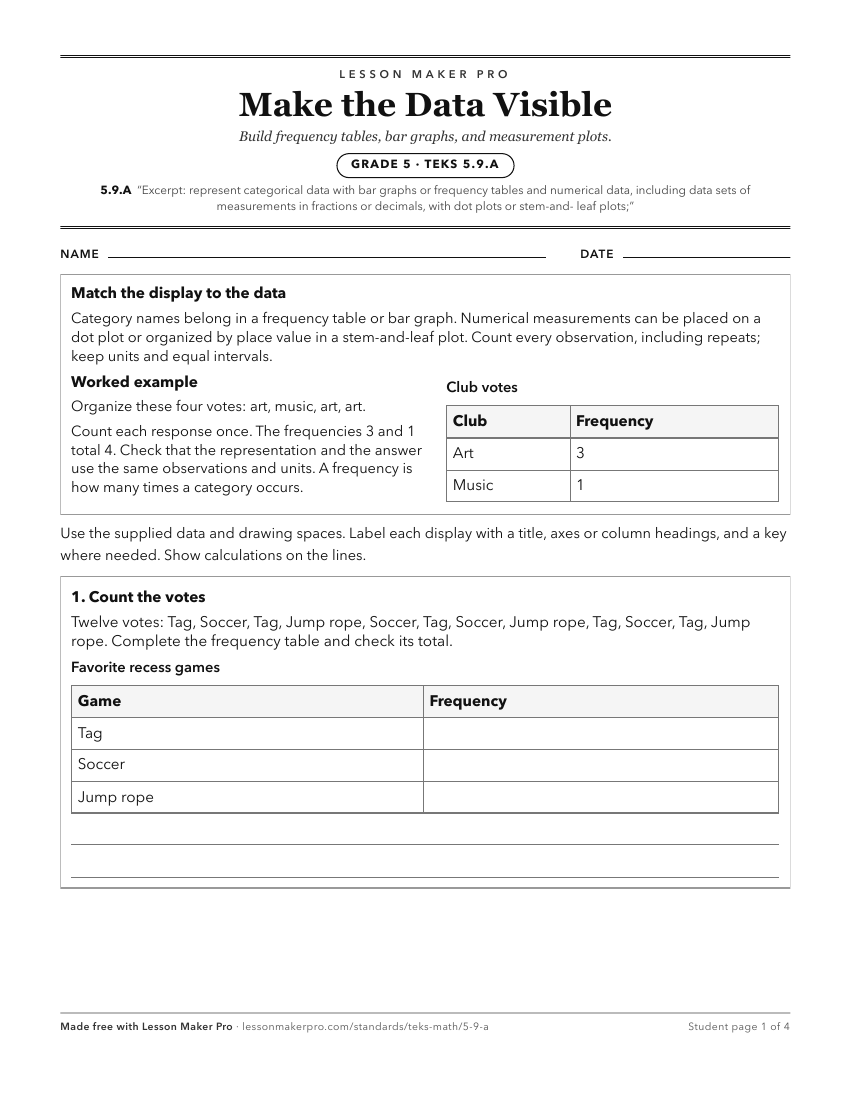
A ready-to-print activity worksheet aligned to 5.9.A, with an answer key for the teacher on its own page. No account needed.
PDF, US Letter, prints cleanly in black and white.
Download the worksheetKeep exploring
Related Standards
- 6.12.D
summarize categorical data with numerical and graphical summaries, including the mode, the percent of values in each category (relative frequency table), and th...
- 4.9.A
represent data on a frequency table, dot plot, or stem-and-leaf plot marked with whole numbers and fractions
- 6.12.A
represent numeric data graphically, including dot plots, stem-and-leaf plots, histograms, and box plots
- 6.13.A
interpret numeric data summarized in dot plots, stem-and-leaf plots, histograms, and box plots
Turn this exact standard into a lesson
Grade, subject, topic, and the complete standard are prefilled. Create one free, no account needed.
Also for this standard:Make a WorksheetMake a QuizMake a Sub Lesson