TEKS Math 7.12.A
The Standard
compare two groups of numeric data using comparative dot plots or box plots by comparing their shapes, centers, and spreads
Texas Essential Knowledge and Skills for Mathematics
Teacher's field guide
What This Standard Means
What Students Need to Do
- Students read two dot plots or box plots drawn on the same scale. They compare shape, a typical value such as the median, and spread using range or IQR. They support each claim with plot features or numbers.
What Mastery Looks Like
- A student identifies the median and compares range or IQR accurately on the same scale. The student describes visible symmetry, skew, clusters, gaps, or outliers when the plot supports it. The final claim states which group is typically higher or more variable and cites evidence.
Common Misconceptions
- Students may compare only the highest values and call that the center. They may confuse range with IQR or think a larger median means greater spread. They may think a longer whisker contains more data rather than the same quartile share.
How to Assess It
- For an exit ticket, have students make same-scale dot plots for A: 2, 3, 3, 4, 4, 4, 5, 5, 6 and B: 1, 2, 3, 4, 4, 5, 6, 7, 8. Ask them to write one comparison each for shape, median, and range, using numbers or plot features as evidence.
Lesson moves
Ways to Teach It
Build two dot plots by stacking linking cubes above taped number lines, then label each median, range, cluster, gap, and outlier.
Show two box plots, then have partners answer which group is more consistent and cite the median and IQR.
Run a card sort matching comparative plots to claim cards, with teams rejecting any claim unsupported by the display.
Plot ten daily high temperatures for two cities, then compare which city is warmer, more variable, and more likely to have extremes.
Free download
Printable 7.12.A Worksheet
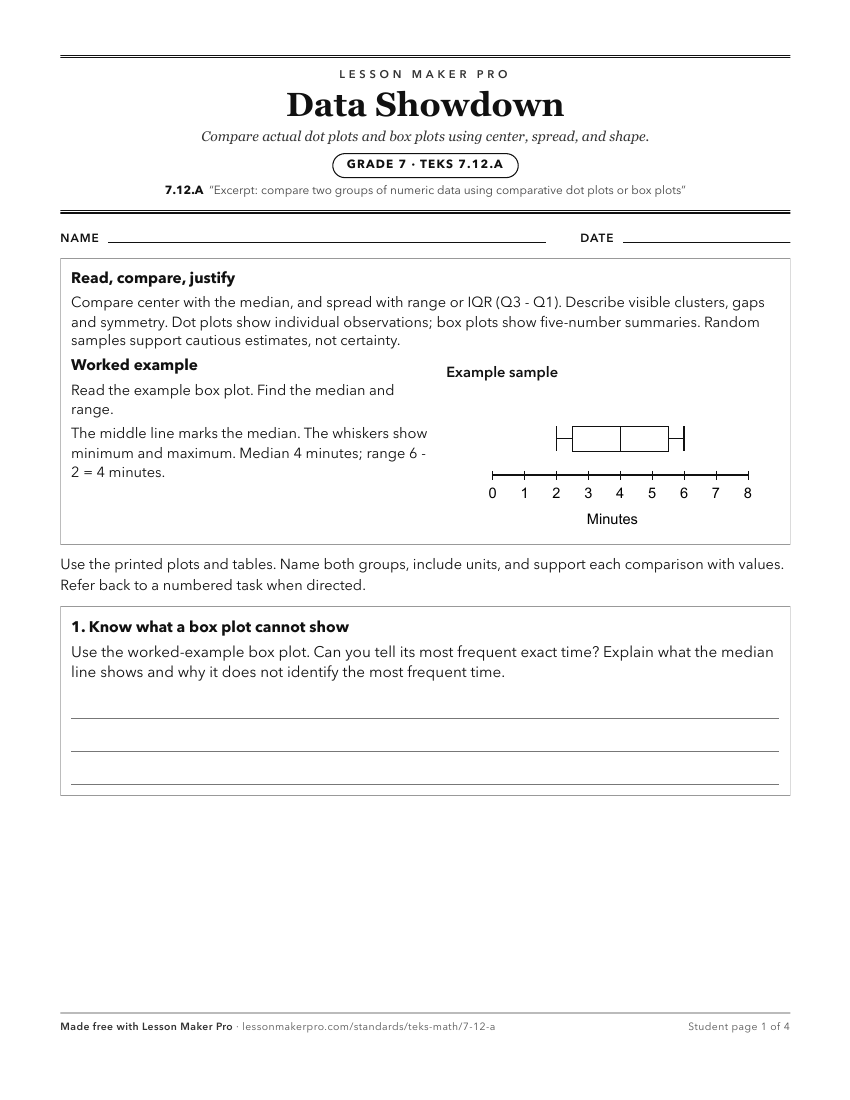
A ready-to-print activity worksheet aligned to 7.12.A, with an answer key for the teacher on its own page. No account needed.
PDF, US Letter, prints cleanly in black and white.
Download the worksheetKeep exploring
Related Standards
- 6.12.B
use the graphical representation of numeric data to describe the center, spread, and shape of the data distribution
- 5.9.A
represent categorical data with bar graphs or frequency tables and numerical data, including data sets of measurements in fractions or decimals, with dot plots ...
- 6.12.A
represent numeric data graphically, including dot plots, stem-and-leaf plots, histograms, and box plots
- 6.13.A
interpret numeric data summarized in dot plots, stem-and-leaf plots, histograms, and box plots
Turn this exact standard into a lesson
Grade, subject, topic, and the complete standard are prefilled. Create one free, no account needed.
Also for this standard:Make a WorksheetMake a QuizMake a Sub Lesson