TEKS Math 6.12.B
The Standard
use the graphical representation of numeric data to describe the center, spread, and shape of the data distribution
Texas Essential Knowledge and Skills for Mathematics
Teacher's field guide
What This Standard Means
What Students Need to Do
- Students read dot plots, histograms, and box plots to locate a typical value and judge how far values vary. They describe symmetry, skew, clusters, gaps, and outliers using evidence from the graph.
What Mastery Looks Like
- A student identifies or estimates the center, gives a sensible measure of spread, and names the overall shape. The student supports each claim with graph details, such as axis values, balanced sides, a long tail, a gap, or an outlier.
Common Misconceptions
- Students may call the tallest bar the center, ignore unequal axis scales, or confuse spread with the number of data points. They may reverse the direction of skew or treat every isolated value as an outlier.
How to Assess It
- Display a dot plot containing 1, 2, 2, 3, 3, 3, 4, and 8. Ask, "State a reasonable center, the range, the shape, and one unusual feature. Cite graph evidence for each."
Lesson moves
Ways to Teach It
Place sticky notes on a floor number line to build a class shoe-size dot plot, then label its center, range, clusters, gaps, and shape.
Show two histograms with the same center but different spreads and ask, "Which group is more consistent, and what graph evidence proves it?"
Play Graph Detective: teams draw cards naming a center, spread, or shape feature and point to matching evidence on posted graphs.
Compare wait-time histograms from two lunch lines and choose the more predictable line, citing center, spread, and shape.
Free download
Printable 6.12.B Worksheet
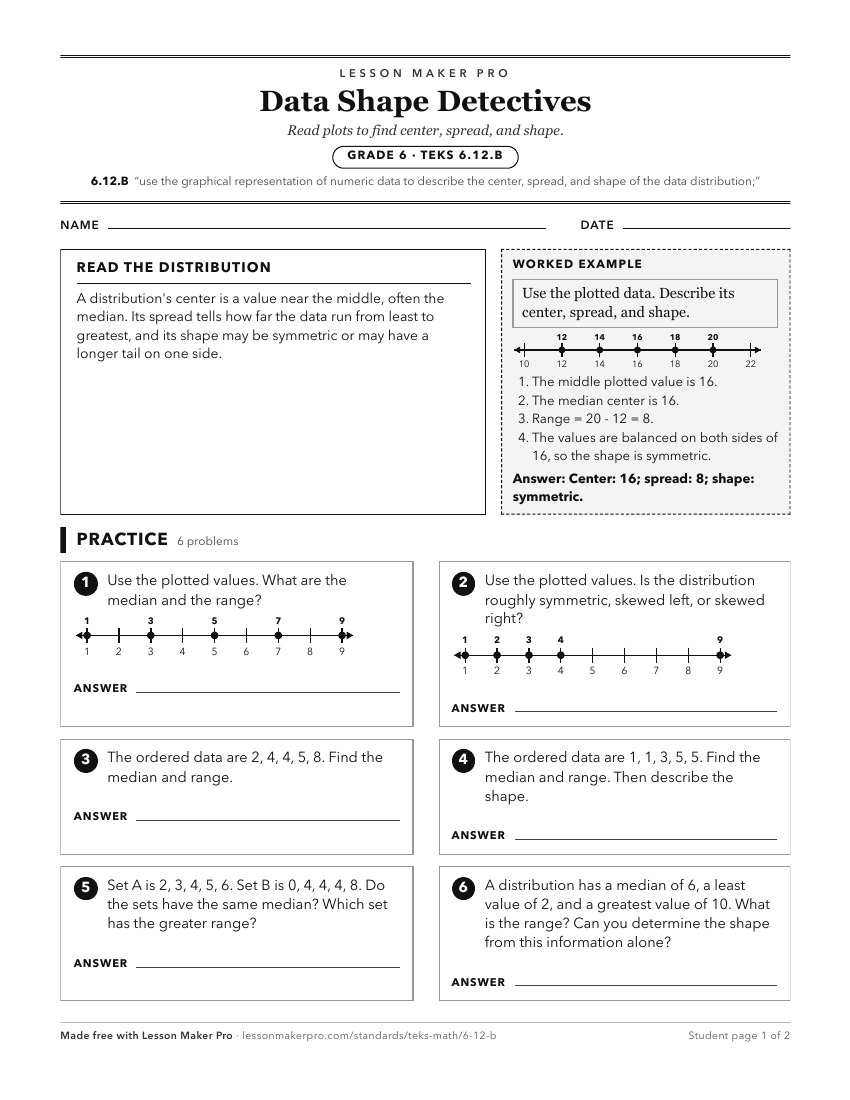
A ready-to-print activity worksheet aligned to 6.12.B, with an answer key for the teacher on its own page. No account needed.
PDF, US Letter, prints cleanly in black and white.
Download the worksheetKeep exploring
Related Standards
- 6.12.D
summarize categorical data with numerical and graphical summaries, including the mode, the percent of values in each category (relative frequency table), and th...
- 6.12.A
represent numeric data graphically, including dot plots, stem-and-leaf plots, histograms, and box plots
- 6.13.A
interpret numeric data summarized in dot plots, stem-and-leaf plots, histograms, and box plots
- 6.12.C
summarize numeric data with numerical summaries, including the mean and median (measures of center) and the range and interquartile range (IQR) (measures of spr...
Turn this exact standard into a lesson
Grade, subject, topic, and the complete standard are prefilled. Create one free, no account needed.
Also for this standard:Make a WorksheetMake a QuizMake a Sub Lesson