TEKS Math 5.9.C
The Standard
solve one- and two-step problems using data from a frequency table, dot plot, bar graph, stem-and-leaf plot, or scatterplot
Texas Essential Knowledge and Skills for Mathematics
Teacher's field guide
What This Standard Means
What Students Need to Do
- Students locate and combine values shown in tables, plots, and graphs. They decide whether to add, subtract, compare, or use two operations to answer a question.
What Mastery Looks Like
- A student reads labels, scales, keys, leaves, and plotted points accurately. The student shows the needed operations, gives a correct answer, and explains which data values were used.
Common Misconceptions
- Students may count categories instead of frequencies or count dots without using their values. They may ignore a bar graph's scale, split stem-and-leaf numbers incorrectly, or swap x- and y-values on scatterplots. In two-step problems, they often stop after finding a subtotal.
How to Assess It
- Give this exit ticket: A frequency table shows 0 books, 2 students; 1 book, 5; 2 books, 4; 3 books, 1. How many more students read fewer than 2 books than read at least 2 books? Show both steps.
Lesson moves
Ways to Teach It
Give pairs linking cubes and a frequency table of pet choices; have them build a bar graph and answer two comparison questions.
Display a stem-and-leaf plot and ask, “Which two values did you use, and why?” after students solve a two-step question.
Run a four-corner game where students move to the operation, add, subtract, multiply, or divide, needed for each graph question.
Use a scatterplot of temperature and lemonade sales; ask students to compare two days and explain the sales pattern.
Free download
Printable 5.9.C Worksheet
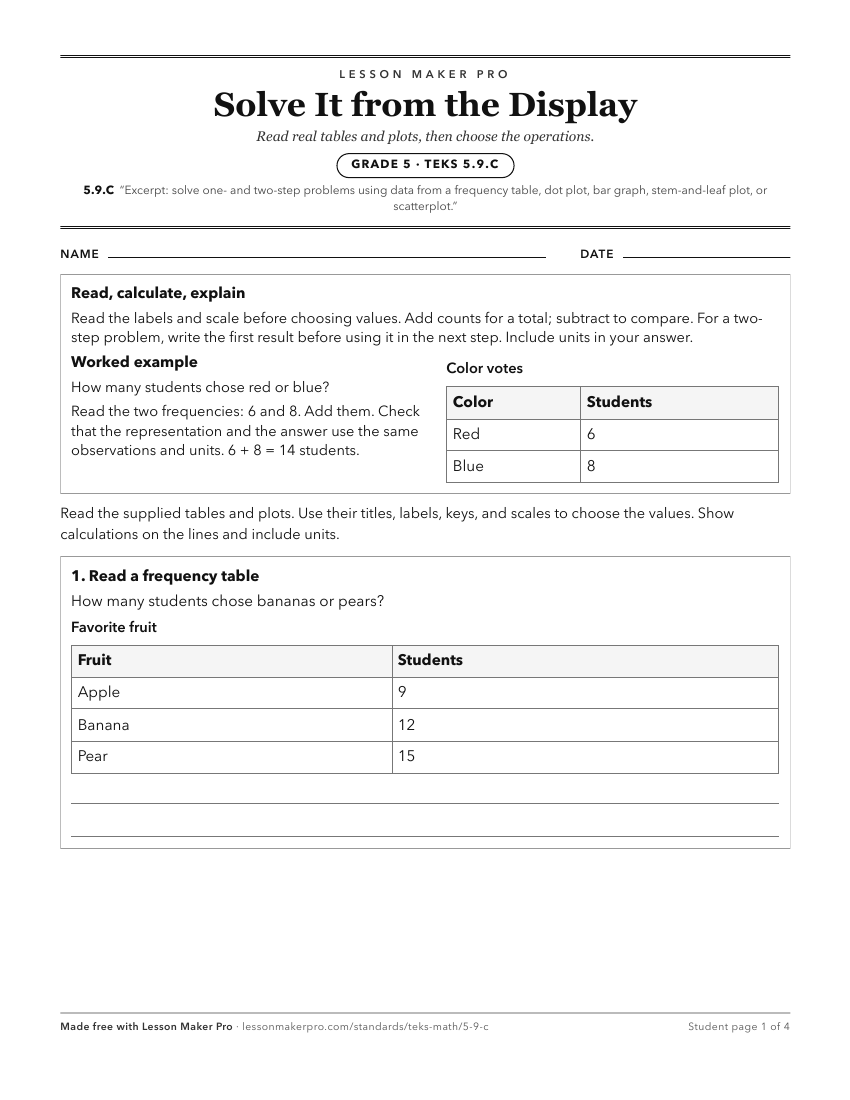
A ready-to-print activity worksheet aligned to 5.9.C, with an answer key for the teacher on its own page. No account needed.
PDF, US Letter, prints cleanly in black and white.
Download the worksheetKeep exploring
Related Standards
- 3.8.B
solve one- and two-step problems using categorical data represented with a frequency table, dot plot, pictograph, or bar graph with scaled intervals
- 4.9.B
solve one- and two-step problems using data in whole number, decimal, and fraction form in a frequency table, dot plot, or stem-and-leaf plot
- 4.9.A
represent data on a frequency table, dot plot, or stem-and-leaf plot marked with whole numbers and fractions
- 7.6.G
solve problems using data represented in bar graphs, dot plots, and circle graphs, including part-to-whole and part-to-part comparisons and equivalents;
Turn this exact standard into a lesson
Grade, subject, topic, and the complete standard are prefilled. Create one free, no account needed.
Also for this standard:Make a WorksheetMake a QuizMake a Sub Lesson