TEKS Math 7.4
Knowledge and Skills Statement (Standard Cluster)
The student applies mathematical process standards to represent and solve problems involving proportional relationships
Texas Essential Knowledge and Skills for Mathematics
Cluster contents
Student Expectations in This Statement
7.4 is a knowledge and skills statement. These are the student expectations under it.
- 7.4.A
represent constant rates of change in mathematical and real-world problems given pictorial, tabular, verbal, numeric, graphical, and algebraic representations, ...
- 7.4.B
calculate unit rates from rates in mathematical and real-world problems
- 7.4.C
determine the constant of proportionality (k = y/x) within mathematical and real-world problems
- 7.4.D
solve problems involving ratios, rates, and percents, including multi-step problems involving percent increase and percent decrease, and financial literacy prob...
- 7.4.E
convert between measurement systems, including the use of proportions and the use of unit rates
Teacher's field guide
What This Cluster Means
What Students Need to Do
- Students identify and represent constant rates in tables, graphs, equations, pictures, and words. They calculate unit rates and proportionality constants, then solve ratio, percent, finance, distance, and measurement conversion problems.
What Mastery Looks Like
- Students move accurately among words, tables, graphs, and equations, and explain why y/x stays constant. They solve multistep rate, percent, money, and measurement problems with correct units and reasonable answers.
Common Misconceptions
- Students may use additive differences instead of checking for a constant ratio. They may calculate x/y instead of y/x, treat every straight line as proportional, apply a percent to the wrong starting amount, or reverse conversion factors.
How to Assess It
- Give this exit ticket: “A cyclist travels 27 miles in 1.5 hours. Find the unit rate, write an equation, and find the distance traveled in 2.5 hours.”
Lesson moves
Ways to Teach It
At measurement stations, students measure objects with inch and centimeter rulers, use a unit rate to convert, then check both readings.
Ask, “How can you tell whether a table, graph, or equation is proportional?” Students cite the constant ratio and origin.
Run a card sort matching rate stories, tables, graphs, and equations. Students record k and reject cards with changing ratios.
Using a grocery ad, students compare unit prices, apply a discount and sales tax, and explain which purchase costs less.
Free download
Printable 7.4 Worksheet
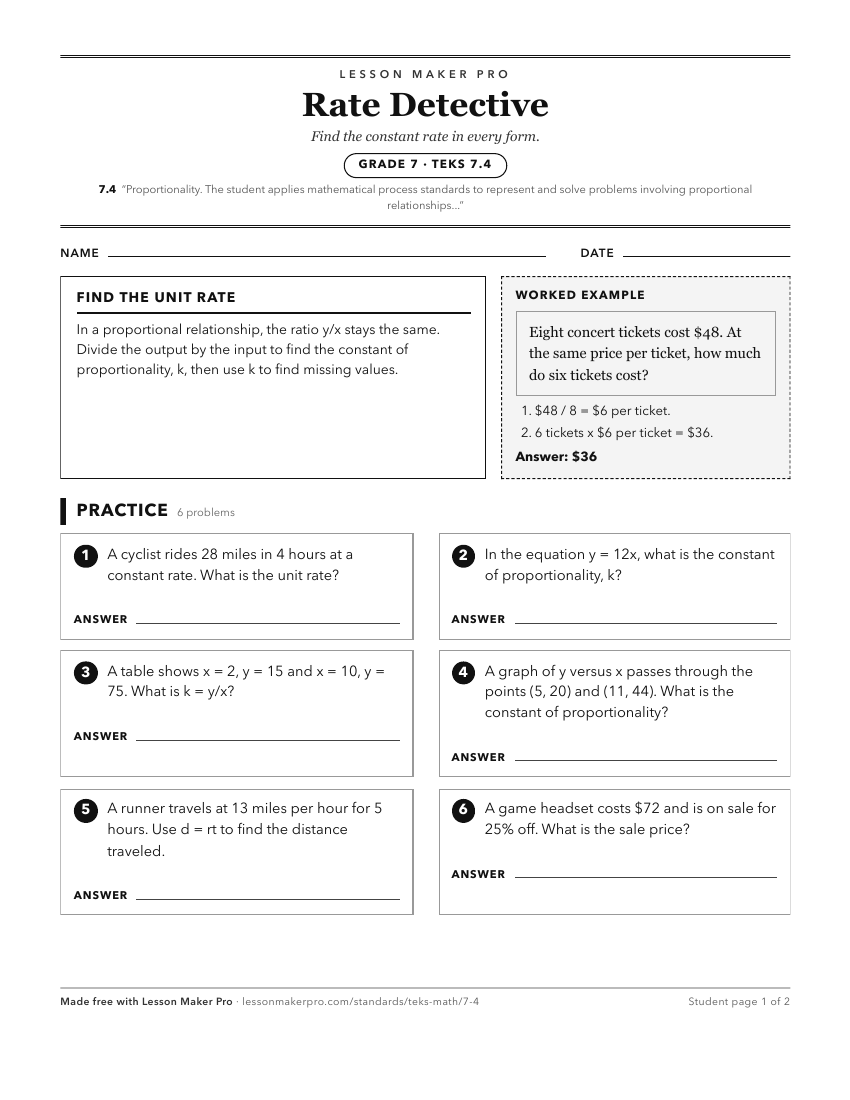
A ready-to-print activity worksheet aligned to 7.4, with an answer key for the teacher on its own page. No account needed.
PDF, US Letter, prints cleanly in black and white.
Download the worksheetKeep exploring
Related Standards
- 7.5
The student applies mathematical process standards to use geometry to describe or solve problems involving proportional relationships
- 6.5
The student applies mathematical process standards to solve problems involving proportional relationships
- 6.4
The student applies mathematical process standards to develop an understanding of proportional relationships in problem situations
- 7.6
The student applies mathematical process standards to use probability and statistics to describe or solve problems involving proportional relationships
Turn this cluster into a lesson
Grade, subject, topic, and the complete cluster are prefilled. Create one free, no account needed.
Also for this cluster:Make a WorksheetMake a QuizMake a Sub Lesson