TEKS Math 7.4.A
The Standard
represent constant rates of change in mathematical and real-world problems given pictorial, tabular, verbal, numeric, graphical, and algebraic representations, including d = rt
Texas Essential Knowledge and Skills for Mathematics
Teacher's field guide
What This Standard Means
What Students Need to Do
- Students identify a constant rate and show it with words, numbers, tables, graphs, pictures, and equations. They connect distance, rate, and time to solve real situations.
What Mastery Looks Like
- Given a table, graph, picture, description, number, or equation, students can find and explain the constant rate. They can create matching representations, label units, and use d = rt to find missing values.
Common Misconceptions
- Students may divide in the wrong order, confuse total distance with speed, or assume every increasing graph has a constant rate. They may switch the time and distance axes or omit units.
How to Assess It
- Exit ticket: A cyclist travels at 12 miles per hour. Write an equation, find the distance after 0.5, 1, and 1.5 hours, then plot the points.
Lesson moves
Ways to Teach It
Students walk at a steady pace along a taped floor, record distance every two seconds, then build a table, graph, and equation.
Students write a claim explaining how a table, graph, and equation each show a constant rate, citing one feature from each.
Give groups cards with matching stories, tables, graphs, rates, and equations, then have them race to assemble complete sets.
Students plan a 180 mile trip at 60 miles per hour and show expected distance after each half hour in three forms.
Free download
Printable 7.4.A Worksheet
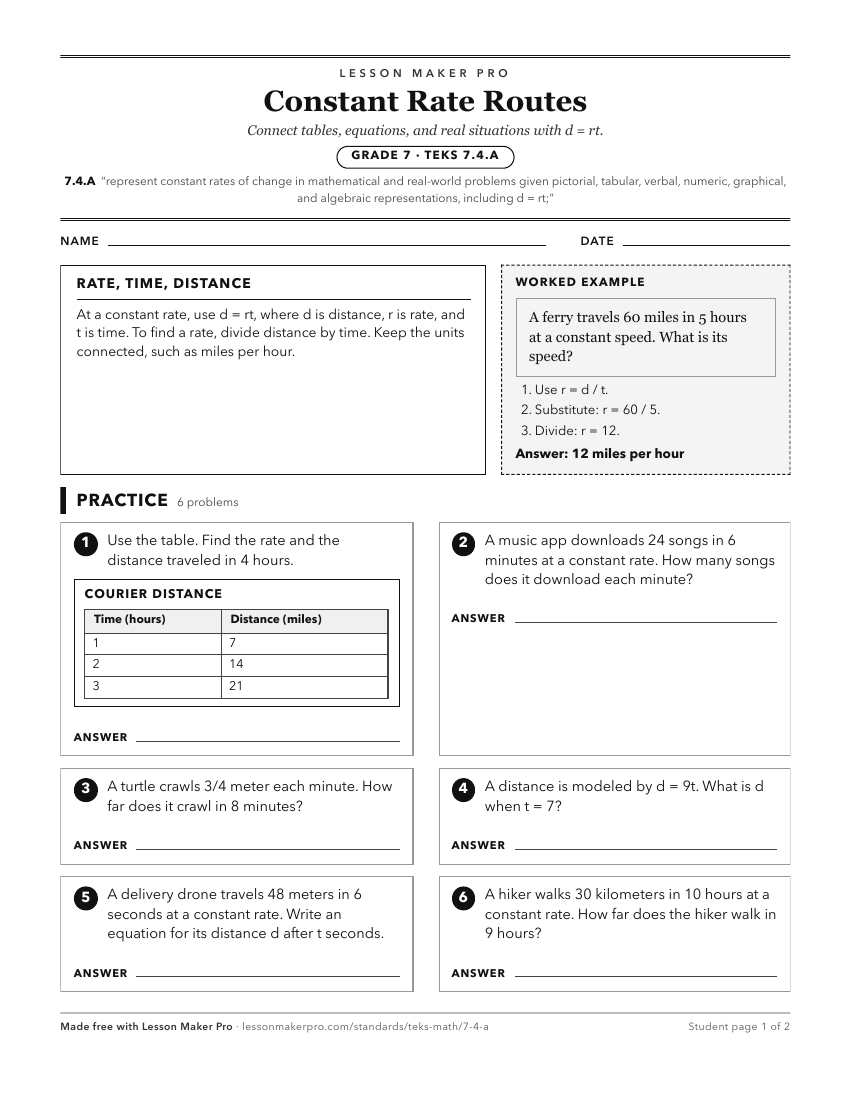
A ready-to-print activity worksheet aligned to 7.4.A, with an answer key for the teacher on its own page. No account needed.
PDF, US Letter, prints cleanly in black and white.
Download the worksheetKeep exploring
Related Standards
- 6.6.C
represent a given situation using verbal descriptions, tables, graphs, and equations in the form y = kx or y = x + b
- 6.5.A
represent mathematical and real-world problems involving ratios and rates using scale factors, tables, graphs, and proportions
- 8.5.A
represent linear proportional situations with tables, graphs, and equations in the form of y = kx
- 8.4.C
use data from a table or graph to determine the rate of change or slope and y-intercept in mathematical and real-world problems
Turn this exact standard into a lesson
Grade, subject, topic, and the complete standard are prefilled. Create one free, no account needed.
Also for this standard:Make a WorksheetMake a QuizMake a Sub Lesson