TEKS Math 8.4.C
The Standard
use data from a table or graph to determine the rate of change or slope and y-intercept in mathematical and real-world problems
Texas Essential Knowledge and Skills for Mathematics
Teacher's field guide
What This Standard Means
What Students Need to Do
- Students use pairs of values to calculate how much y changes for each one-unit change in x. They identify the value of y when x is zero and explain both numbers in context.
What Mastery Looks Like
- Students correctly calculate slope from any two table rows or graph points. They identify the output when x equals zero and explain both values using units from the situation.
Common Misconceptions
- Students may divide the output by the input instead of finding the change in output divided by the change in input. They may mistake the first table value or lowest graph point for the y-intercept, even when x is not zero.
How to Assess It
- Give the table x: 0, 2, 4 and y: 5, 11, 17. Ask students to find the slope and y-intercept, then explain what each represents.
Lesson moves
Ways to Teach It
Place tape points on a floor coordinate grid, then have students walk the rise and run and stand at the y-intercept.
Ask students to explain why the y-intercept is an initial value and how they can locate it in a table or graph.
Run a card sort matching tables, graphs, slope values, and y-intercepts, with students checking each match using calculations.
Compare two phone plans shown in tables, then identify each starting fee and cost per gigabyte to decide when each plan is cheaper.
Free download
Printable 8.4.C Worksheet
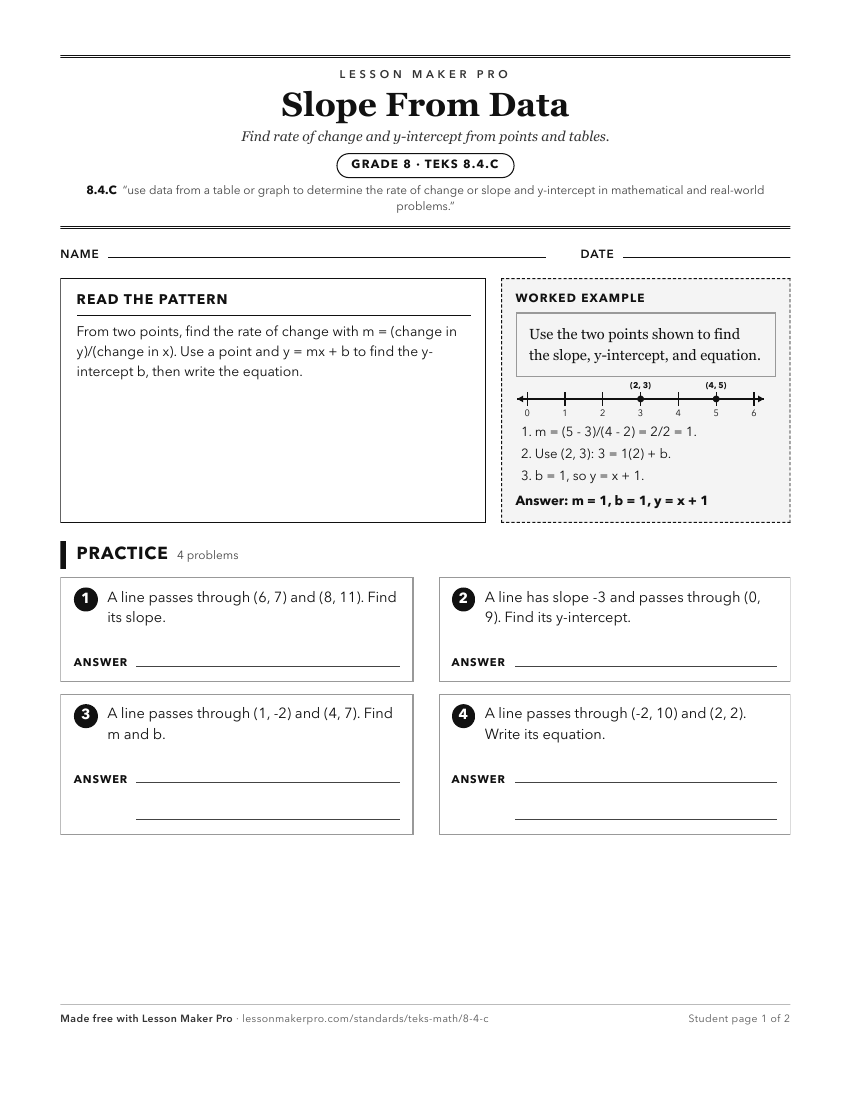
A ready-to-print activity worksheet aligned to 8.4.C, with an answer key for the teacher on its own page. No account needed.
PDF, US Letter, prints cleanly in black and white.
Download the worksheetKeep exploring
Related Standards
- 6.6.C
represent a given situation using verbal descriptions, tables, graphs, and equations in the form y = kx or y = x + b
- 8.5.B
represent linear non-proportional situations with tables, graphs, and equations in the form of y = mx + b, where b ≠ 0
- 7.4.A
represent constant rates of change in mathematical and real-world problems given pictorial, tabular, verbal, numeric, graphical, and algebraic representations, ...
- 6.5.A
represent mathematical and real-world problems involving ratios and rates using scale factors, tables, graphs, and proportions
Turn this exact standard into a lesson
Grade, subject, topic, and the complete standard are prefilled. Create one free, no account needed.
Also for this standard:Make a WorksheetMake a QuizMake a Sub Lesson