TEKS Math 6.5.A
The Standard
represent mathematical and real-world problems involving ratios and rates using scale factors, tables, graphs, and proportions
Texas Essential Knowledge and Skills for Mathematics
Teacher's field guide
What This Standard Means
What Students Need to Do
- Students identify the multiplicative relationship between two quantities and use it to generate equivalent pairs. They show the same relationship in a table, on a graph, with a scale factor, and as a proportion.
What Mastery Looks Like
- A student can show one situation with an equivalent-ratio table, ordered pairs, a graph, and a proportion. The student uses a consistent scale factor and explains what each number means with units.
Common Misconceptions
- Students may add the same amount to both quantities instead of multiplying by the same factor. They may reverse ratio order, mix units, or place quantities on the wrong graph axes. Some assume every table is proportional without checking for a constant rate.
How to Assess It
- Exit ticket: A recipe uses 3 cups of flour for 4 servings. Complete a table for 8 and 10 servings, graph the points, and solve 3/4 = x/10.
Lesson moves
Ways to Teach It
Use red and blue counters to build a 2:3 ratio, then scale the groups and record each pair in a table.
Ask, "How can you prove that 12 miles in 3 hours and 20 miles in 5 hours show the same rate?"
Give groups matching cards with situations, tables, graphs, and proportions, then have them justify each completed set.
Compare two grocery package sizes by finding unit prices, building tables, and graphing cost against quantity.
Free download
Printable 6.5.A Worksheet
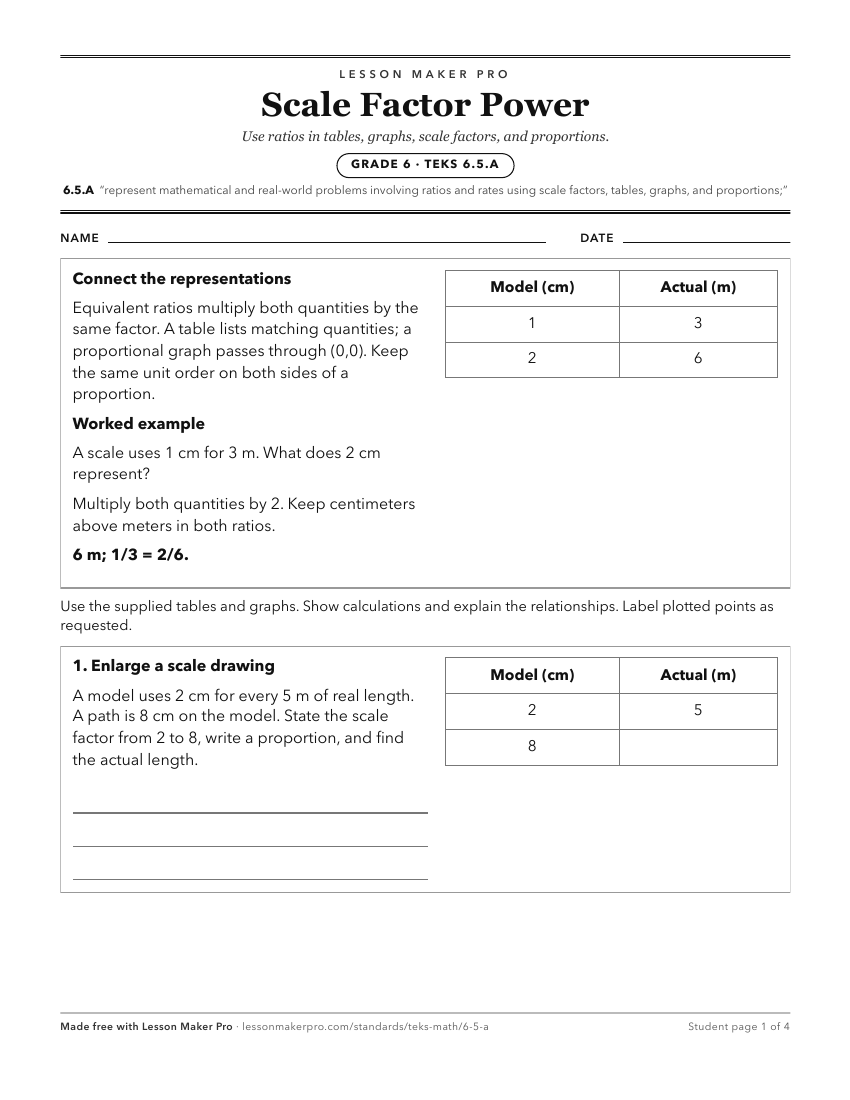
A ready-to-print activity worksheet aligned to 6.5.A, with an answer key for the teacher on its own page. No account needed.
PDF, US Letter, prints cleanly in black and white.
Download the worksheetKeep exploring
Related Standards
- 6.4.B
apply qualitative and quantitative reasoning to solve prediction and comparison of real-world problems involving ratios and rates
- 7.4
The student applies mathematical process standards to represent and solve problems involving proportional relationships
- 6.4.E
represent ratios and percents with concrete models, fractions, and decimals
- 6.4
The student applies mathematical process standards to develop an understanding of proportional relationships in problem situations
Turn this exact standard into a lesson
Grade, subject, topic, and the complete standard are prefilled. Create one free, no account needed.
Also for this standard:Make a WorksheetMake a QuizMake a Sub Lesson