TEKS Math 7.6.H
The Standard
solve problems using qualitative and quantitative predictions and comparisons from simple experiments
Texas Essential Knowledge and Skills for Mathematics
Teacher's field guide
What This Standard Means
What Students Need to Do
- Students decide which outcomes are more, less, or equally likely. They make numerical predictions, then compare expected results with data from an experiment.
What Mastery Looks Like
- A student can predict how often an outcome should occur in a set number of trials. The student can compare expected and observed counts or proportions and explain reasonable differences.
Common Misconceptions
- Students may assume all possible outcomes are equally likely. They may expect experimental results to match predictions exactly or compare raw counts when trial totals differ.
How to Assess It
- Exit ticket: A bag has 3 red, 2 blue, and 1 green counter. For 60 draws with replacement, predict each color count, then compare your prediction with results of 27 red, 22 blue, and 11 green.
Lesson moves
Ways to Teach It
Spin a paper-clip spinner 40 times, record each result, and compare the observed counts with predicted counts.
Ask students to explain why two groups using the same number cube might get different results after 20 rolls.
Play a matching game where students pair experiment cards with reasonable predictions and result tables.
Use a basketball player's free-throw record to predict makes in the next 20 attempts, then compare with actual results.
Free download
Printable 7.6.H Worksheet
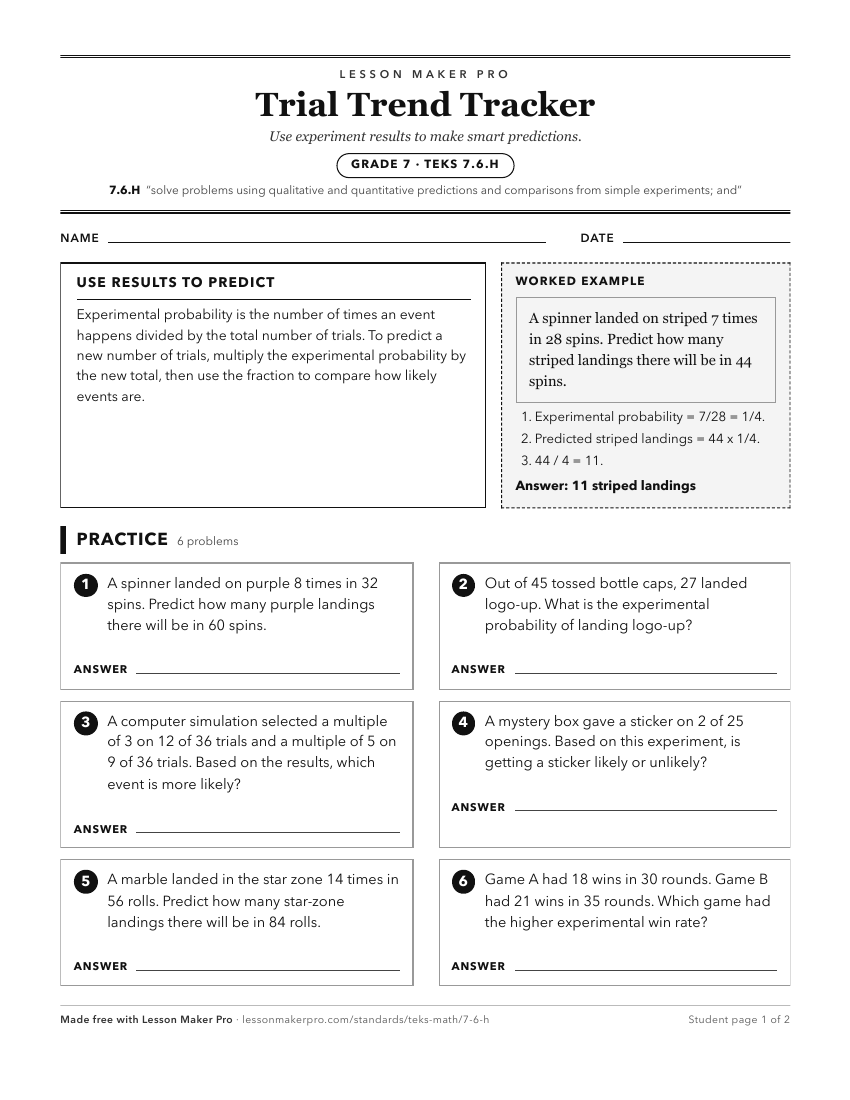
A ready-to-print activity worksheet aligned to 7.6.H, with an answer key for the teacher on its own page. No account needed.
PDF, US Letter, prints cleanly in black and white.
Download the worksheetKeep exploring
Related Standards
- 7.6.D
make predictions and determine solutions using theoretical probability for simple and compound events
- 6.4.B
apply qualitative and quantitative reasoning to solve prediction and comparison of real-world problems involving ratios and rates
- 7.6.C
make predictions and determine solutions using experimental data for simple and compound events
- 7.6.G
solve problems using data represented in bar graphs, dot plots, and circle graphs, including part-to-whole and part-to-part comparisons and equivalents;
Turn this exact standard into a lesson
Grade, subject, topic, and the complete standard are prefilled. Create one free, no account needed.
Also for this standard:Make a WorksheetMake a QuizMake a Sub Lesson