TEKS Math 7.6.F
The Standard
use data from a random sample to make inferences about a population
Texas Essential Knowledge and Skills for Mathematics
Teacher's field guide
What This Standard Means
What Students Need to Do
- Students use results from a randomly selected group to estimate a count, proportion, or percent for a larger group. They explain that the result is a reasonable estimate, not an exact value.
What Mastery Looks Like
- A student can turn a sample result into a proportion or percent, then apply it to the population size. The student labels the result as an estimate and explains why random selection supports the inference.
Common Misconceptions
- Students may treat a sample estimate as an exact population value. They may trust convenience samples, ignore sample size, or scale sample counts incorrectly.
How to Assess It
- Give this exit ticket: “In a random sample of 40 students, 14 prefer soccer. About how many of 600 students would prefer soccer? Explain.”
Lesson moves
Ways to Teach It
Place colored tiles in a covered bag, let groups draw random samples, and use each sample to estimate the bag’s color totals.
Ask students to write which survey is more reliable, 50 randomly selected students or 50 cafeteria volunteers, and defend their choice.
Play Sample Showdown, where teams calculate population estimates from sample cards and earn points for correct work and clear reasoning.
Use a local election poll to estimate candidate support, then discuss why the reported result may differ from the final vote.
Free download
Printable 7.6.F Worksheet
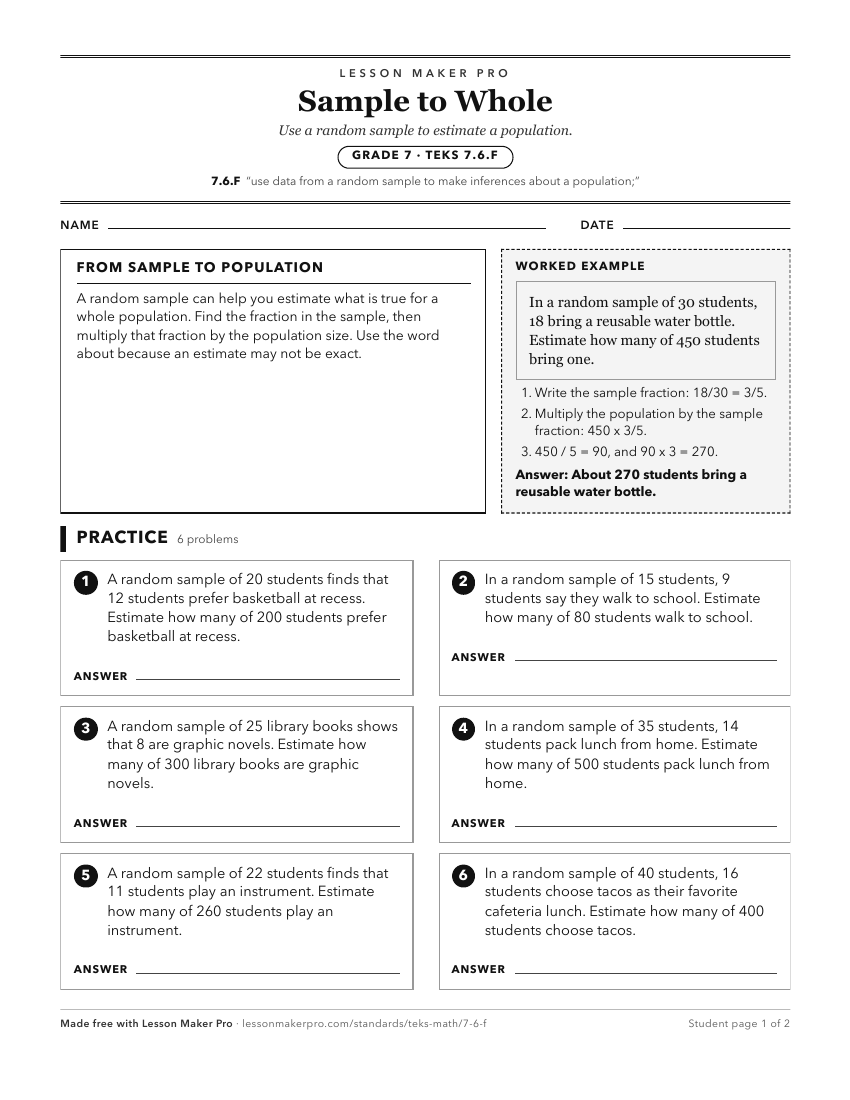
A ready-to-print activity worksheet aligned to 7.6.F, with an answer key for the teacher on its own page. No account needed.
PDF, US Letter, prints cleanly in black and white.
Download the worksheetKeep exploring
Related Standards
- 7.12.B
The 7th Grade version of this standard.
- 7.12.C
compare two populations based on data in random samples from these populations, including informal comparative inferences about differences between the two popu...
- 8.11.C
simulate generating random samples of the same size from a population with known characteristics to develop the notion of a random sample being representative o...
- 2.10.D
draw conclusions and make predictions from information in a graph
Turn this exact standard into a lesson
Grade, subject, topic, and the complete standard are prefilled. Create one free, no account needed.
Also for this standard:Make a WorksheetMake a QuizMake a Sub Lesson