TEKS Math 8.11.C
The Standard
simulate generating random samples of the same size from a population with known characteristics to develop the notion of a random sample being representative of the population from which it was selected
Texas Essential Knowledge and Skills for Mathematics
Teacher's field guide
What This Standard Means
What Students Need to Do
- Students repeatedly select random samples of equal size from a population whose makeup is known. They compare each sample's proportions with the population and explain why some samples are closer than others.
What Mastery Looks Like
- A student can use a fair random method, record results from several equal-sized samples, and calculate sample proportions. The student identifies which samples are representative and explains that random samples vary by chance.
Common Misconceptions
- Students may choose convenient or balanced groups instead of using chance. They may expect every random sample to match the population exactly, or assume one unusual sample proves the method is biased.
How to Assess It
- A bag has 60 red and 40 blue tiles. Use a random integer generator to create three samples of 10, then compare their red proportions with the population proportion.
Lesson moves
Ways to Teach It
Fill a bag with 30 red and 20 blue counters; teams draw ten, replace all counters, and repeat five times to compare proportions.
Show two sets of five equal-sized sample results and ask, “Which set better reflects the population, and why might results differ?”
Teams use a random number generator to build six samples of 20 from a 70 percent yes population, scoring closeness to 70 percent.
Use a full class survey as the known population, then randomly sample eight names repeatedly and compare each result with the class proportion.
Free download
Printable 8.11.C Worksheet
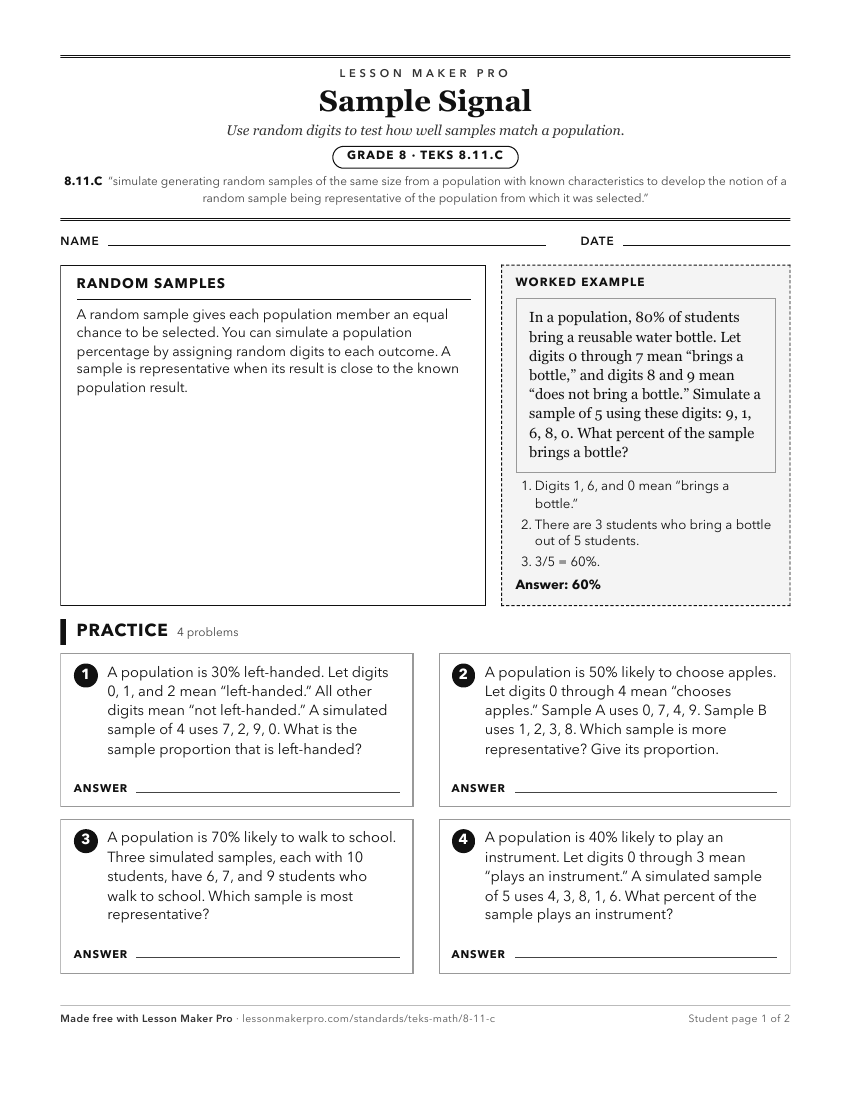
A ready-to-print activity worksheet aligned to 8.11.C, with an answer key for the teacher on its own page. No account needed.
PDF, US Letter, prints cleanly in black and white.
Download the worksheetKeep exploring
Related Standards
- 7.12.B
use data from a random sample to make inferences about a population
- 7.12.C
compare two populations based on data in random samples from these populations, including informal comparative inferences about differences between the two popu...
- 7.6.F
use data from a random sample to make inferences about a population
- 7.6.I
determine experimental and theoretical probabilities related to simple and compound events using data and sample spaces.
Turn this exact standard into a lesson
Grade, subject, topic, and the complete standard are prefilled. Create one free, no account needed.
Also for this standard:Make a WorksheetMake a QuizMake a Sub Lesson