TEKS Math 7.12.C
The Standard
compare two populations based on data in random samples from these populations, including informal comparative inferences about differences between the two populations
Texas Essential Knowledge and Skills for Mathematics
Teacher's field guide
What This Standard Means
What Students Need to Do
- Students examine random sample data from two groups. They compare typical values, variability, and overlap, then make a cautious claim about how the full groups may differ.
What Mastery Looks Like
- Students compare sample centers, spreads, and overlap accurately. They use those features to make a reasonable claim about the populations and describe the claim as likely, not certain.
Common Misconceptions
- Students may treat one sample as a perfect picture of the whole population. They may compare only medians and ignore spread or overlap. They may also claim that a small sample difference proves the populations are different.
How to Assess It
- Exit ticket: Random sample A is 4, 5, 5, 6, 6, 7, 7, 8. Random sample B is 6, 7, 7, 8, 8, 9, 9, 10. Which population likely has larger values? Use medians and overlap, then state one limitation.
Lesson moves
Ways to Teach It
Draw 15 number cards from each of two bags, make side-by-side dot plots, and compare centers, spreads, and overlap.
Write a claim answering, "Which school has longer bus rides?" then support it with sample medians, ranges, and overlap.
Play Sample Showdown: teams draw repeated samples from two data sets and earn points for conclusions that match their evidence.
Compare random samples of grocery wait times from two checkout lines and recommend a line using median and variability.
Free download
Printable 7.12.C Worksheet
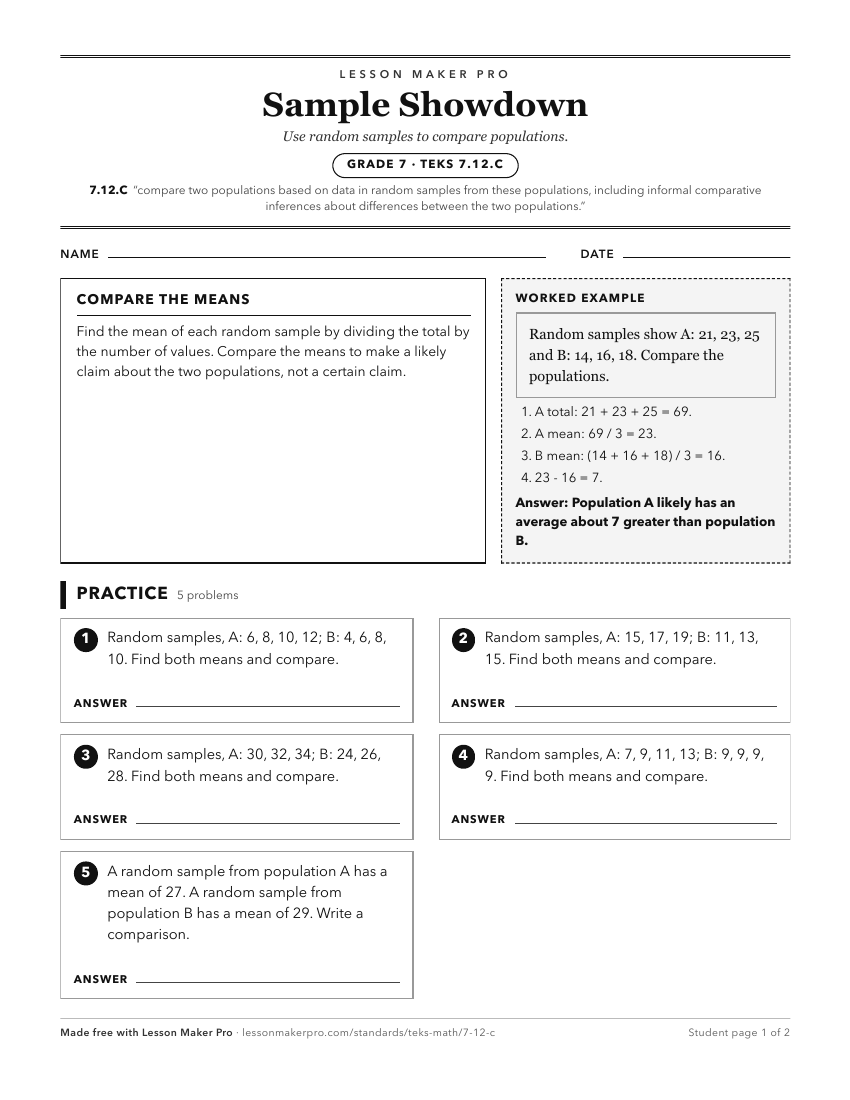
A ready-to-print activity worksheet aligned to 7.12.C, with an answer key for the teacher on its own page. No account needed.
PDF, US Letter, prints cleanly in black and white.
Download the worksheetKeep exploring
Related Standards
- 7.12.B
use data from a random sample to make inferences about a population
- K.7.B
compare two objects with a common measurable attribute to see which object has more of/less of the attribute and describe the difference
- 7.12.A
compare two groups of numeric data using comparative dot plots or box plots by comparing their shapes, centers, and spreads
- 7.6.F
use data from a random sample to make inferences about a population
Turn this exact standard into a lesson
Grade, subject, topic, and the complete standard are prefilled. Create one free, no account needed.
Also for this standard:Make a WorksheetMake a QuizMake a Sub Lesson