TEKS Math 7.12.B
The Standard
use data from a random sample to make inferences about a population
Texas Essential Knowledge and Skills for Mathematics
Teacher's field guide
What This Standard Means
What Students Need to Do
- Students use results from a randomly chosen group to estimate a proportion, total, or average for a larger group. They explain why the sampling method supports the estimate.
What Mastery Looks Like
- Students use a sample proportion or average to estimate a value for a larger group. They state that the estimate is reasonable, not exact, and connect it to how the sample was chosen.
Common Misconceptions
- Students may assume a sample result matches the whole population exactly. They may also trust biased samples or think a small convenience sample is representative.
How to Assess It
- Give students survey results from 40 randomly selected seventh graders. Ask them to estimate how many of 300 seventh graders would choose the same response and explain the estimate.
Lesson moves
Ways to Teach It
Place colored counters in a hidden bag, let groups draw random samples, then estimate the total number of each color.
Ask students to write which survey is more trustworthy, 50 randomly chosen students or 50 volunteers from basketball practice, and explain why.
Play Estimate the Population, where teams use sample proportions from cards to predict totals and earn points for correct calculations and reasoning.
Use a random sample of cafeteria receipts to estimate how many students buy lunch during a full school week.
Free download
Printable 7.12.B Worksheet
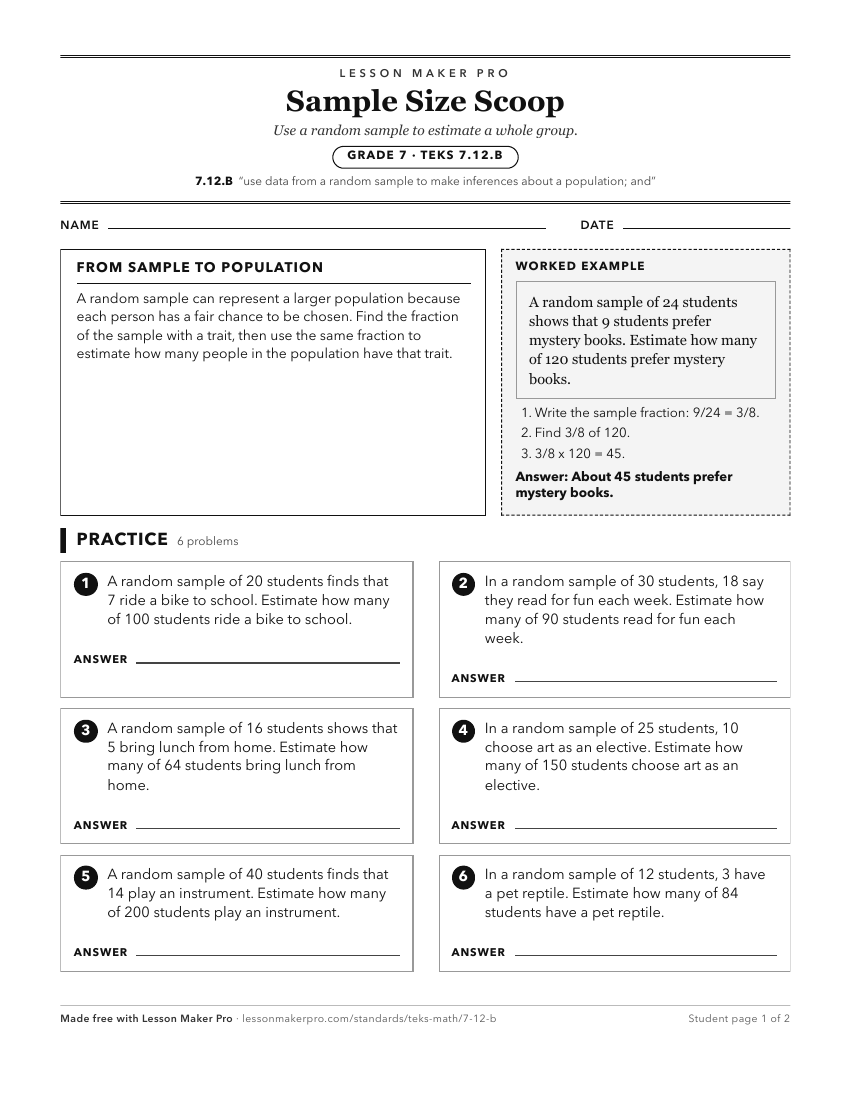
A ready-to-print activity worksheet aligned to 7.12.B, with an answer key for the teacher on its own page. No account needed.
PDF, US Letter, prints cleanly in black and white.
Download the worksheetKeep exploring
Related Standards
- 7.12.C
compare two populations based on data in random samples from these populations, including informal comparative inferences about differences between the two popu...
- 8.11.C
simulate generating random samples of the same size from a population with known characteristics to develop the notion of a random sample being representative o...
- 7.6.F
The 7th Grade version of this standard.
- 2.10.D
draw conclusions and make predictions from information in a graph
Turn this exact standard into a lesson
Grade, subject, topic, and the complete standard are prefilled. Create one free, no account needed.
Also for this standard:Make a WorksheetMake a QuizMake a Sub Lesson