TEKS Math 2.10.D
The Standard
draw conclusions and make predictions from information in a graph
Texas Essential Knowledge and Skills for Mathematics
Teacher's field guide
What This Standard Means
What Students Need to Do
- Students read graph titles, labels, categories, and amounts. They describe what the data shows and make a reasonable prediction supported by the graph.
What Mastery Looks Like
- A student can identify the greatest and least amounts and compare categories correctly. The student can make a reasonable prediction and point to specific graph data as support.
Common Misconceptions
- Students may ignore labels or the scale and judge only by bar height. They may confuse “how many more” with the total. They may also make a prediction based on preference instead of graph evidence.
How to Assess It
- Show a fruit survey graph with apples 8, bananas 5, and oranges 3. Ask students to write one conclusion and predict the likely winner in another similar class, citing the graph.
Lesson moves
Ways to Teach It
Survey classmates about favorite recess games, build cube columns, then state one conclusion and predict two absent classmates’ choices.
Display a class snack graph and ask, “What can we conclude, and what evidence in the graph supports your answer?”
Play Graph Detective with cards showing graphs, conclusion prompts, and prediction prompts for partners to solve and check.
Graph daily classroom pencil use for five days, then predict how many pencils the class may need tomorrow.
Free download
Printable 2.10.D Worksheet
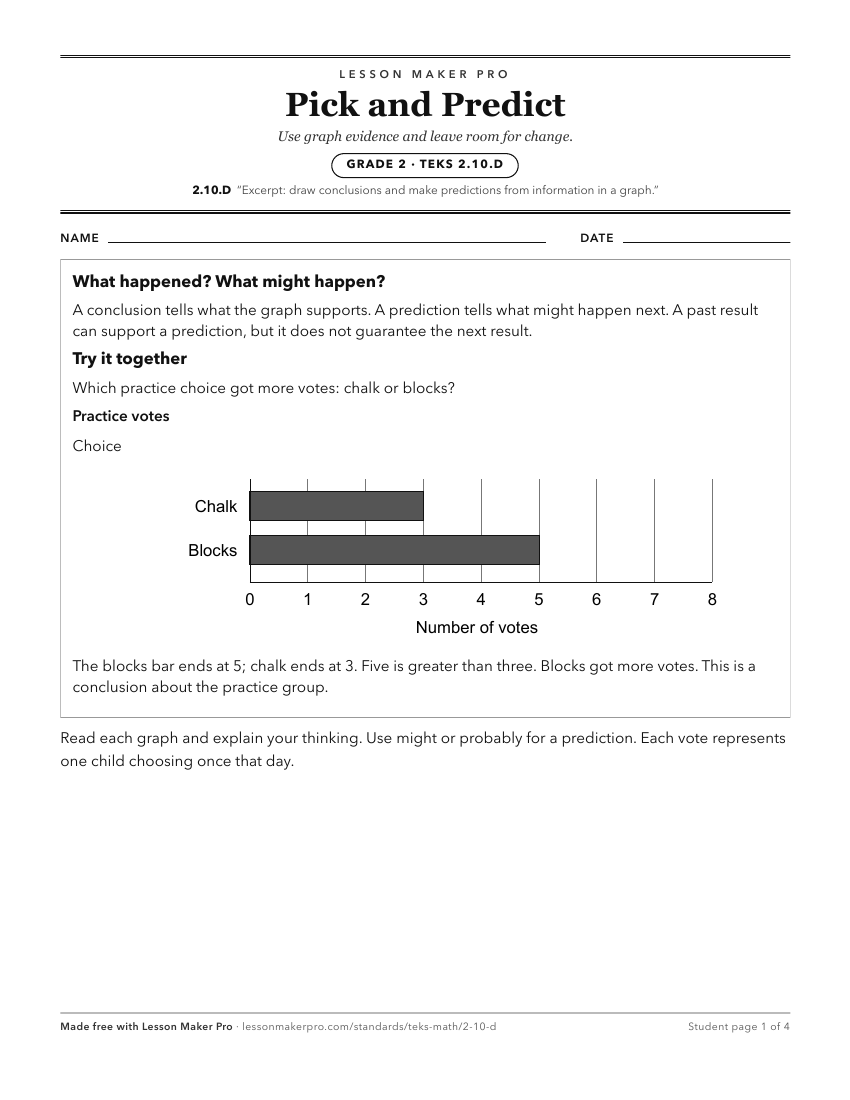
A ready-to-print activity worksheet aligned to 2.10.D, with an answer key for the teacher on its own page. No account needed.
PDF, US Letter, prints cleanly in black and white.
Download the worksheetKeep exploring
Related Standards
Turn this exact standard into a lesson
Grade, subject, topic, and the complete standard are prefilled. Create one free, no account needed.
Also for this standard:Make a WorksheetMake a QuizMake a Sub Lesson