TEKS Math 1.8.C
The Standard
draw conclusions and generate and answer questions using information from picture and bar-type graphs
Texas Essential Knowledge and Skills for Mathematics
Teacher's field guide
What This Standard Means
What Students Need to Do
- Students read picture graphs and simple bar graphs. They count and compare categories, state what the data shows, and create questions that can be answered from the graph.
What Mastery Looks Like
- A student can name each category, count its total, and compare categories correctly. The student can state a conclusion supported by the graph and create a question the graph can answer.
Common Misconceptions
- Students may count grid lines instead of filled units or skip a category. They may reverse “how many more” or give a conclusion that the graph does not support.
How to Assess It
- Show a graph with cats 6, dogs 4, and fish 2. Ask which pet was chosen most, how many more chose cats than fish, and one new question.
Lesson moves
Ways to Teach It
Have pairs survey classmates about favorite fruit, build a cube bar graph, and write two facts supported by the data.
Display a picture graph of lunch choices and ask, “What can you prove, and which graph detail proves it?”
Play Graph Detective: partners draw question cards, answer from a three-category graph, then check each answer together.
Graph daily weather symbols for one week, then have students compare totals and describe which weather occurred most and least often.
Free download
Printable 1.8.C Worksheet
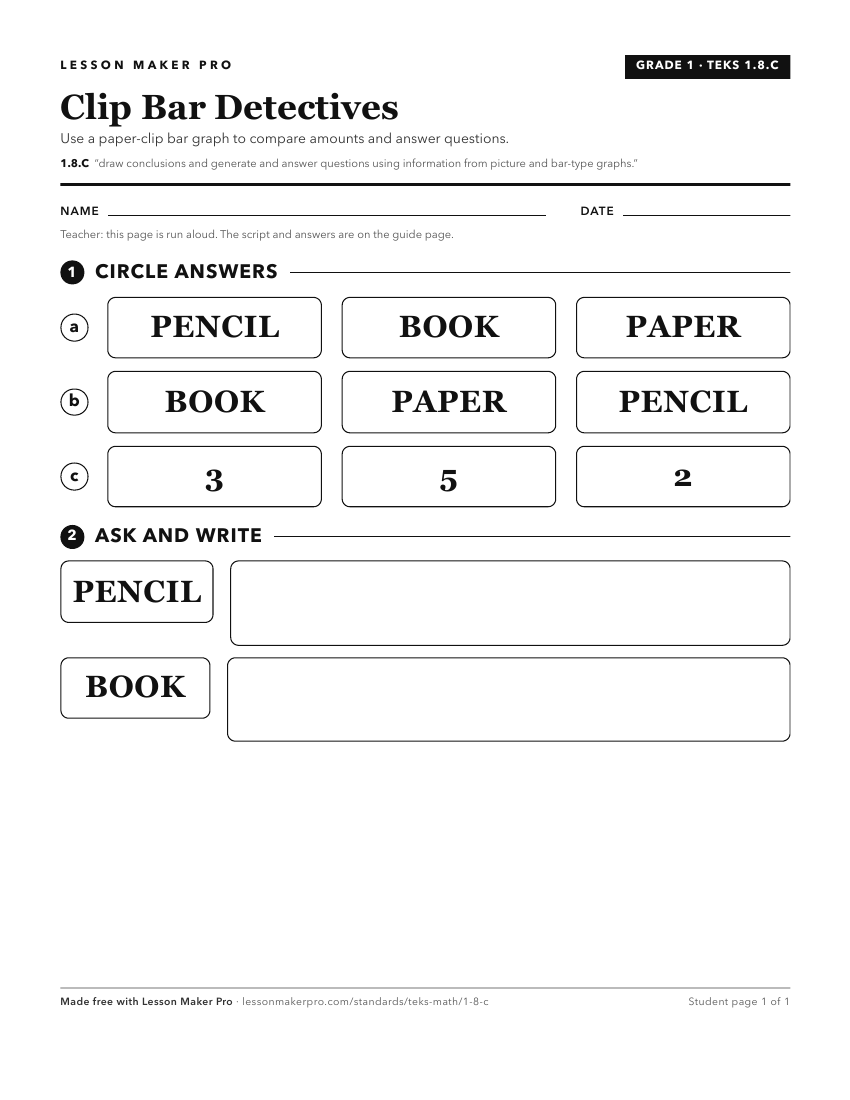
A ready-to-print activity worksheet aligned to 1.8.C, with an answer key for the teacher on its own page. No account needed.
PDF, US Letter, prints cleanly in black and white.
Download the worksheetKeep exploring
Related Standards
Turn this exact standard into a lesson
Grade, subject, topic, and the complete standard are prefilled. Create one free, no account needed.
Also for this standard:Make a WorksheetMake a QuizMake a Sub Lesson