TEKS Math K.8.B
The Standard
use data to create real-object and picture graphs
Texas Essential Knowledge and Skills for Mathematics
Teacher's field guide
What This Standard Means
What Students Need to Do
- Students collect or receive simple category data and organize it into clear rows or columns. They use one object or picture to represent each item counted.
What Mastery Looks Like
- Students place each object or picture in the correct group, with one mark for each data point. They organize rows clearly so another person can count and read the graph.
Common Misconceptions
- Students may place items randomly instead of in labeled groups. They may leave uneven spaces, count a picture twice, or draw a different number of pictures than objects.
How to Assess It
- Give each student three red counters, five blue counters, and a two-row graph mat. Ask them to arrange the counters, then draw a matching picture graph.
Lesson moves
Ways to Teach It
Give pairs toy animals and a labeled graph mat, then have them sort and line up the animals by type.
Show a picture graph and ask, “How did the graph maker organize the data, and what should each picture represent?”
Students roll a color cube ten times, record each result, then build a picture graph using matching color stickers.
Survey classmates about their favorite fruit, then create a class picture graph with one fruit card for each vote.
Free download
Printable K.8.B Worksheet
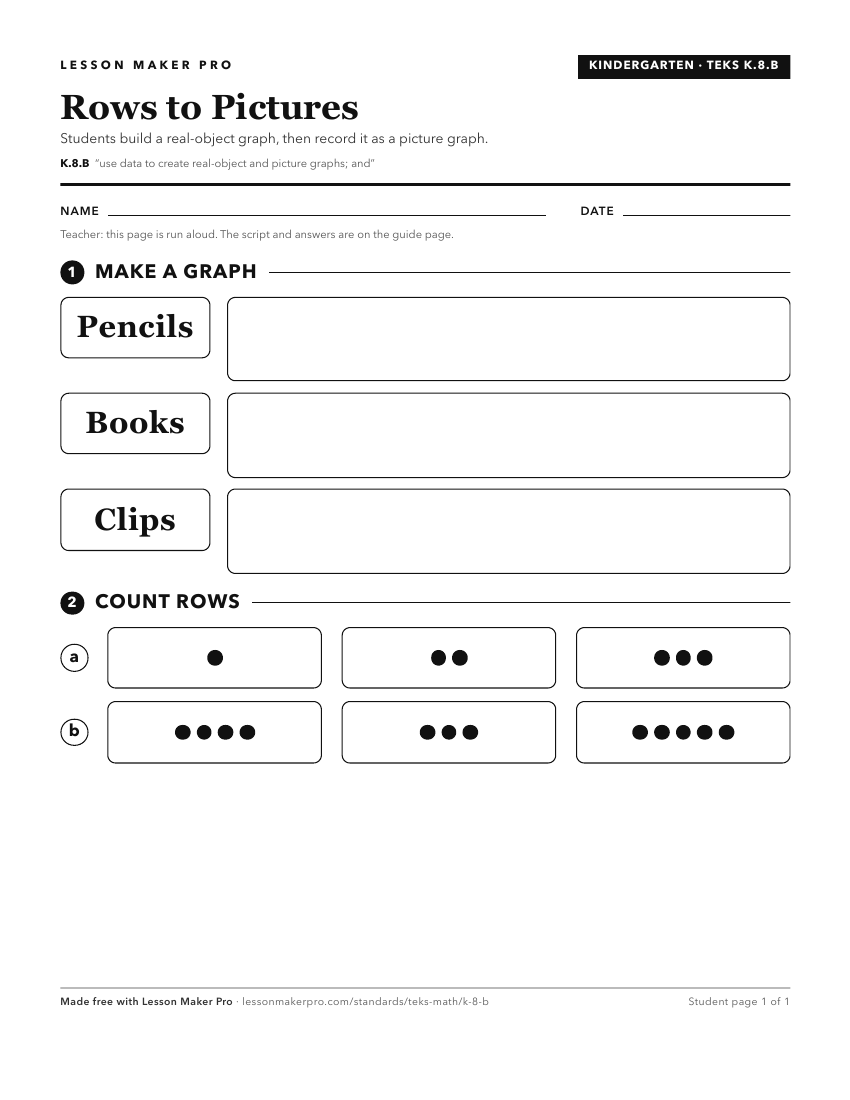
A ready-to-print activity worksheet aligned to K.8.B, with an answer key for the teacher on its own page. No account needed.
PDF, US Letter, prints cleanly in black and white.
Download the worksheetKeep exploring
Related Standards
- 1.8.C
draw conclusions and generate and answer questions using information from picture and bar-type graphs
- K.8.C
draw conclusions from real-object and picture graphs
- 1.8.B
use data to create picture and bar-type graphs
- 7.6.G
solve problems using data represented in bar graphs, dot plots, and circle graphs, including part-to-whole and part-to-part comparisons and equivalents;
Turn this exact standard into a lesson
Grade, subject, topic, and the complete standard are prefilled. Create one free, no account needed.
Also for this standard:Make a WorksheetMake a QuizMake a Sub Lesson