Florida B.E.S.T. MA.912.DP.2
B.E.S.T. Standard (Benchmark Cluster)
Solve problems involving univariate and bivariate numerical data.
Florida B.E.S.T. Standards for Mathematics
Cluster contents
Benchmarks in This Standard
MA.912.DP.2 is a B.E.S.T. standard. These are the benchmarks under it.
- MA.912.DP.2.1
For two or more sets of numerical univariate data, calculate and compare the appropriate measures of center and measures of variability, accounting for possible...
- MA.912.DP.2.2
Use the mean and standard deviation of a data set to fit it to a normal distribution and to estimate population percentages. Recognize that there are data sets ...
- MA.912.DP.2.3
Estimate population percentages from data that has been fit to the normal distribution.
- MA.912.DP.2.4
Fit a linear function to bivariate numerical data that suggests a linear association and interpret the slope and y-intercept of the model. Use the model to solv...
- MA.912.DP.2.5
Given a scatter plot that represents bivariate numerical data, assess the fit of a given linear function by plotting and analyzing residuals.
- MA.912.DP.2.6
Given a scatter plot with a line of fit and residuals, determine the strength and direction of the correlation. Interpret strength and direction within a real-w...
- MA.912.DP.2.7
Compute the correlation coefficient of a linear model using technology. Interpret the strength and direction of the correlation coefficient.
- MA.912.DP.2.8
Fit a quadratic function to bivariate numerical data that suggests a quadratic association and interpret any intercepts or the vertex of the model. Use the mode...
- MA.912.DP.2.9
Fit an exponential function to bivariate numerical data that suggests an exponential association. Use the model to solve real-world problems in terms of the con...
Teacher's field guide
What This Cluster Means
What Students Need to Do
- Students analyze one numerical variable or the relationship between two numerical variables. They make and interpret graphs, calculate useful statistics, compare groups, identify patterns, and justify conclusions from data.
What Mastery Looks Like
- Students choose suitable graphs and statistics, then use them to answer a question. They compare distributions, describe relationships between variables, account for outliers, and support conclusions with numerical evidence.
Common Misconceptions
- Students may treat correlation as proof that one variable causes the other. They may overlook outliers, compare graphs with different scales, or use a mean when the median better represents skewed data.
How to Assess It
- Give students a scatter plot and a box plot from the same data set. Ask them to identify one pattern, one unusual value, and one supported conclusion.
Lesson moves
Ways to Teach It
Give pairs a data set, sticky notes, and graph paper to build a box plot and scatter plot, then mark outliers.
Ask students to write whether study time causes higher test scores, using evidence from a provided scatter plot and noting limits.
Run a card sort matching data sets, graphs, summary statistics, and valid conclusions, with teams correcting mismatched sets.
Use local weather data to compare monthly temperatures and examine the relationship between temperature and electricity use.
Free download
Printable MA.912.DP.2 Worksheet
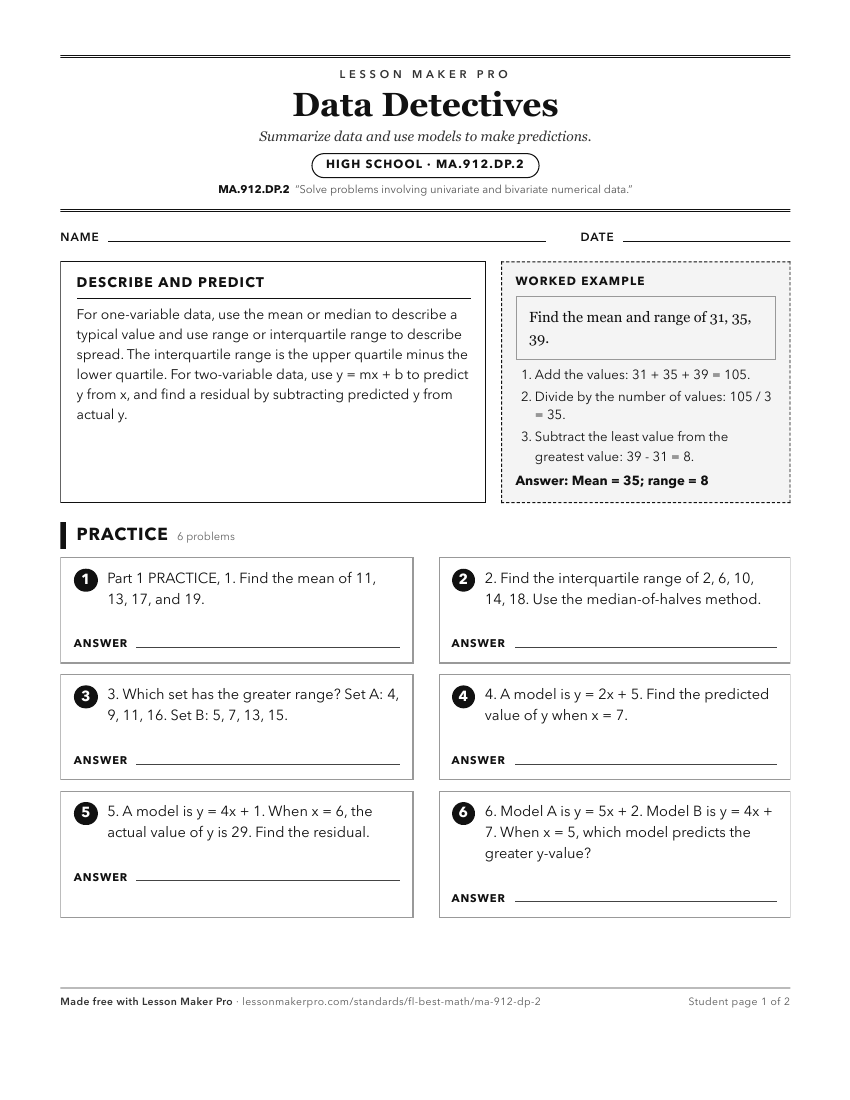
A ready-to-print activity worksheet aligned to MA.912.DP.2, with an answer key for the teacher on its own page. No account needed.
PDF, US Letter, prints cleanly in black and white.
Download the worksheetKeep exploring
Related Standards
Turn this cluster into a lesson
Grade, subject, topic, and the complete cluster are prefilled. Create one free, no account needed.
Also for this cluster:Make a WorksheetMake a QuizMake a Sub Lesson