Florida B.E.S.T. MA.912.DP.2.8
The Standard
Fit a quadratic function to bivariate numerical data that suggests a quadratic association and interpret any intercepts or the vertex of the model. Use the model to solve real-world problems in terms of the context of the data.
Florida B.E.S.T. Standards for Mathematics
Teacher's field guide
What This Standard Means
What Students Need to Do
- Students decide when a curved scatterplot supports a quadratic model and use technology to find an equation. They explain intercepts and the vertex using the data’s units and context. They use the model to predict values or find a maximum or minimum.
What Mastery Looks Like
- Given a data table or scatterplot, students can find a reasonable quadratic regression equation and use it to answer a context question. Their interpretation includes units, identifies a maximum or minimum, rejects irrelevant roots, and stays within a reasonable input range.
Common Misconceptions
- Students may choose a quadratic model without checking whether the scatterplot has a curved pattern. They may treat every root as meaningful or use the y-intercept when an input of zero makes no sense. They may swap vertex coordinates, confuse a maximum with a minimum, or predict far beyond the data range.
How to Assess It
- Exit ticket: A ball has heights 2, 18, 24, 20, and 6 feet at times 0, 1, 2, 3, and 4 seconds. Use quadratic regression, interpret the vertex, and estimate when the ball reaches the ground.
Lesson moves
Ways to Teach It
Record a tossed foam ball beside a meter stick, sample heights from video, run quadratic regression, and label the vertex and intercepts.
Present a scatterplot and model, then ask, “What makes a quadratic reasonable, and what do the vertex and intercepts mean here?”
Use a card sort matching data tables, scatterplots, equations, vertices, intercepts, and context statements, requiring students to justify each set.
Model profit versus ticket price from a small data table, then use the vertex to recommend a price and explain domain limits.
Free download
Printable MA.912.DP.2.8 Worksheet
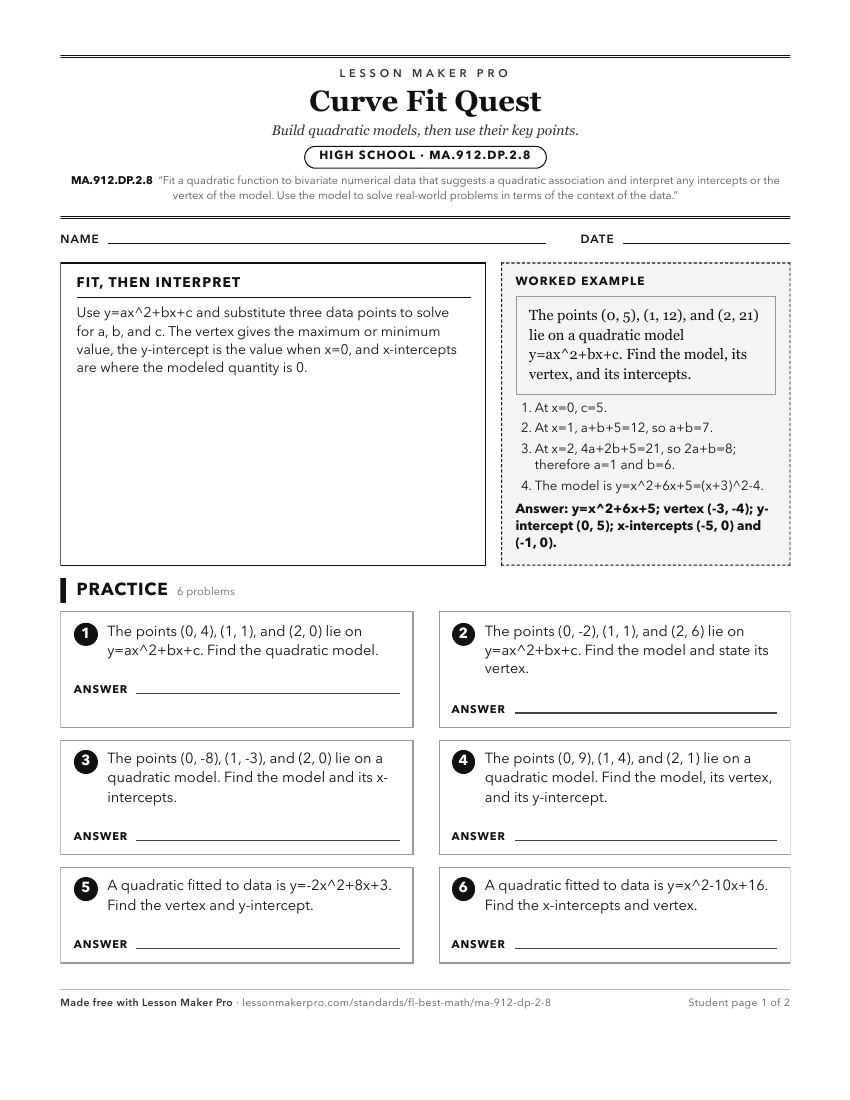
A ready-to-print activity worksheet aligned to MA.912.DP.2.8, with an answer key for the teacher on its own page. No account needed.
PDF, US Letter, prints cleanly in black and white.
Download the worksheetKeep exploring
Related Standards
- MA.912.AR.3.8
Solve and graph mathematical and real-world problems that are modeled with quadratic functions. Interpret key features and determine constraints in terms of the...
- MA.912.AR.3.6
Given an expression or equation representing a quadratic function, determine the vertex and zeros and interpret them in terms of a real-world context.
- MA.912.DP.2.4
Fit a linear function to bivariate numerical data that suggests a linear association and interpret the slope and y-intercept of the model. Use the model to solv...
- MA.912.DP.2.9
Fit an exponential function to bivariate numerical data that suggests an exponential association. Use the model to solve real-world problems in terms of the con...
Turn this exact standard into a lesson
Grade, subject, topic, and the complete standard are prefilled. Create one free, no account needed.
Also for this standard:Make a WorksheetMake a QuizMake a Sub Lesson