Florida B.E.S.T. MA.912.DP.2.9
The Standard
Fit an exponential function to bivariate numerical data that suggests an exponential association. Use the model to solve real-world problems in terms of the context of the data.
Florida B.E.S.T. Standards for Mathematics
Teacher's field guide
What This Standard Means
What Students Need to Do
- Students decide whether a scatter plot shows exponential growth or decay, then use technology to find a regression equation. They use the equation to predict values and explain each result in context.
What Mastery Looks Like
- A student can enter paired data, run exponential regression, and write a model in the form y = ab^x. They can identify the initial value and growth or decay factor, make reasonable predictions, and include units.
Common Misconceptions
- Students may choose a linear model simply because the points rise or fall. They may report the base as the percent rate, miss that decay has a base between 0 and 1, or make unsupported predictions far beyond the data.
How to Assess It
- Exit ticket: For times 0, 1, 2, 3 hours and bacteria counts 100, 150, 225, 338, find an exponential model and predict the count at 5 hours. Interpret the growth factor.
Lesson moves
Ways to Teach It
Give groups cups and beans, double the beans each round, record totals, graph the data, and fit an exponential equation.
Ask, "How can the graph and ratios show exponential rather than linear change?" Students write a claim using two data points.
Run a model-match card sort with data tables, scatter plots, exponential equations, and context statements. Teams justify each completed set.
Use medicine concentration data to model decay, then estimate when the concentration falls below a stated safe threshold.
Free download
Printable MA.912.DP.2.9 Worksheet
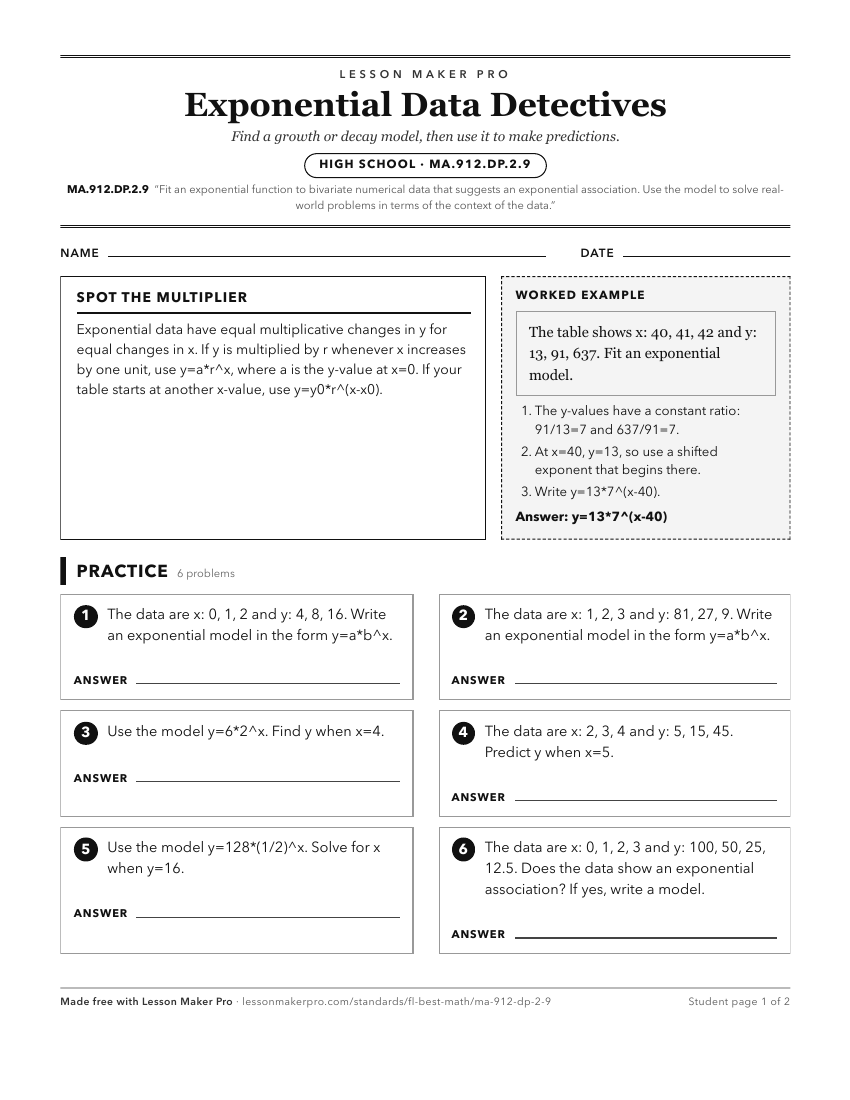
A ready-to-print activity worksheet aligned to MA.912.DP.2.9, with an answer key for the teacher on its own page. No account needed.
PDF, US Letter, prints cleanly in black and white.
Download the worksheetKeep exploring
Related Standards
- MA.912.AR.5.4
Write an exponential function to represent a relationship between two quantities from a graph, a written description or a table of values within a mathematical ...
- MA.912.AR.5.7
Solve and graph mathematical and real-world problems that are modeled with exponential functions. Interpret key features and determine constraints in terms of t...
- MA.912.DP.2.4
Fit a linear function to bivariate numerical data that suggests a linear association and interpret the slope and y-intercept of the model. Use the model to solv...
- MA.912.DP.2.8
Fit a quadratic function to bivariate numerical data that suggests a quadratic association and interpret any intercepts or the vertex of the model. Use the mode...
Turn this exact standard into a lesson
Grade, subject, topic, and the complete standard are prefilled. Create one free, no account needed.
Also for this standard:Make a WorksheetMake a QuizMake a Sub Lesson