Florida B.E.S.T. MA.912.DP.2.4
The Standard
Fit a linear function to bivariate numerical data that suggests a linear association and interpret the slope and y-intercept of the model. Use the model to solve real-world problems in terms of the context of the data.
Florida B.E.S.T. Standards for Mathematics
Teacher's field guide
What This Standard Means
What Students Need to Do
- Students plot paired numerical data and fit a line that represents the overall trend. They explain the slope and y-intercept using the situation and use the equation to make predictions.
What Mastery Looks Like
- Students choose a reasonable line that follows the overall pattern of the data. They state the slope as a rate with units and explain the y-intercept in context. They use the equation to make and judge predictions.
Common Misconceptions
- Students may treat any scattered data as perfectly linear or connect points instead of fitting one line. They often describe slope without units or confuse it with the starting value. They may trust predictions far beyond the observed data.
How to Assess It
- Give the data pairs (1, 58), (2, 63), (3, 69), (4, 74), and (5, 79), where x is study hours and y is test score. Ask students to fit a line, interpret both parameters, and predict the score for 6 hours.
Lesson moves
Ways to Teach It
Stack identical cups, measure tower height for different cup counts, plot the pairs, and fit a linear model.
Ask students to explain what each parameter in a phone data-cost model means, including its units.
Play Match the Model by pairing scatter plots, equations, slope interpretations, and prediction cards.
Use local hourly wage and hours-worked data to model weekly pay, then predict earnings for a new schedule.
Free download
Printable MA.912.DP.2.4 Worksheet
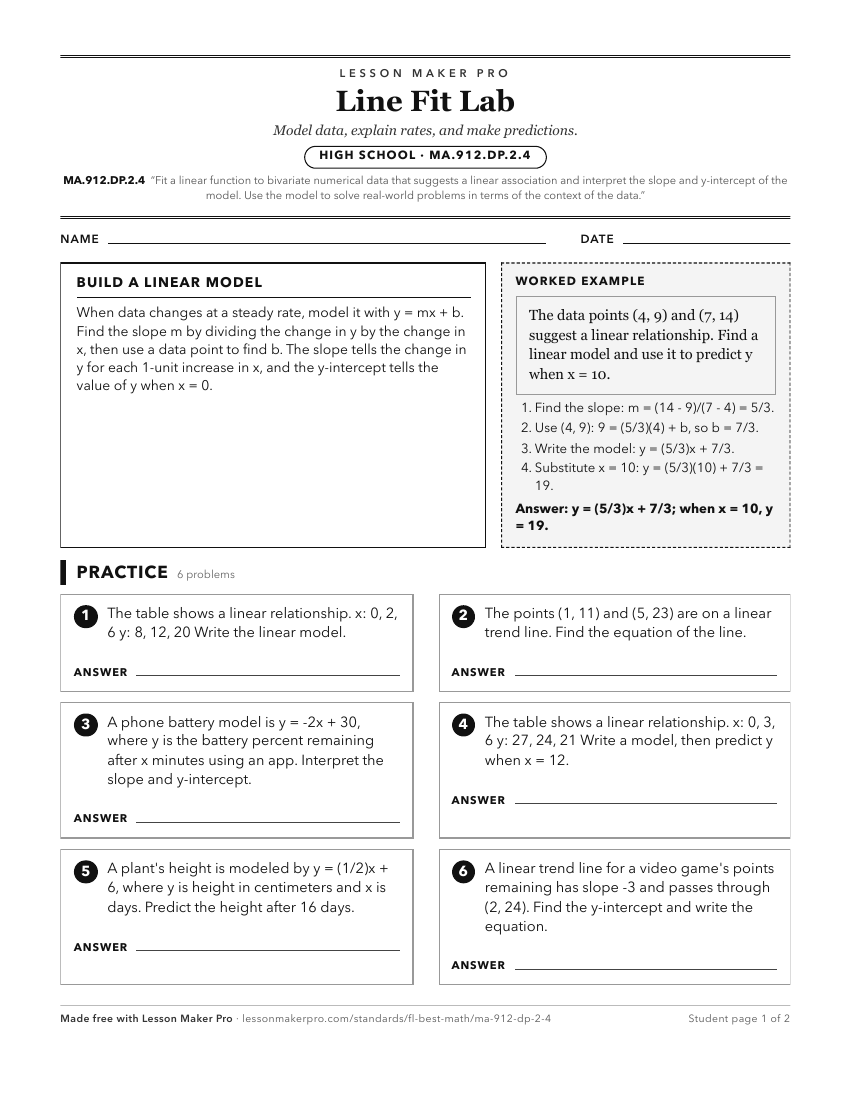
A ready-to-print activity worksheet aligned to MA.912.DP.2.4, with an answer key for the teacher on its own page. No account needed.
PDF, US Letter, prints cleanly in black and white.
Download the worksheetKeep exploring
Related Standards
- MA.912.DP.2.5
Given a scatter plot that represents bivariate numerical data, assess the fit of a given linear function by plotting and analyzing residuals.
- MA.8.AR.3.5
Given a real-world context, determine and interpret the slope and y-intercept of a two-variable linear equation from a written description, a table, a graph or ...
- MA.912.DP.2.8
Fit a quadratic function to bivariate numerical data that suggests a quadratic association and interpret any intercepts or the vertex of the model. Use the mode...
- MA.912.DP.2.9
Fit an exponential function to bivariate numerical data that suggests an exponential association. Use the model to solve real-world problems in terms of the con...
Turn this exact standard into a lesson
Grade, subject, topic, and the complete standard are prefilled. Create one free, no account needed.
Also for this standard:Make a WorksheetMake a QuizMake a Sub Lesson