Florida B.E.S.T. MA.912.DP.2.5
The Standard
Given a scatter plot that represents bivariate numerical data, assess the fit of a given linear function by plotting and analyzing residuals.
Florida B.E.S.T. Standards for Mathematics
Teacher's field guide
What This Standard Means
What Students Need to Do
- Students use a linear equation to find predicted values, then subtract predicted values from observed values. They plot those residuals and decide whether the pattern supports a linear model.
What Mastery Looks Like
- A student correctly computes each residual as observed value minus predicted value and plots it against the explanatory variable. The student uses spread and visible patterns around zero to make and support a fit decision.
Common Misconceptions
- Students may subtract in the wrong order, using predicted minus observed instead of observed minus predicted. They may judge fit only by small residuals and ignore curved patterns, clusters, or residuals mostly above or below zero.
How to Assess It
- Exit ticket: Plot (1,4), (2,4), (3,8), and (4,8), then test y = 2x + 1. Calculate and plot each residual, then explain whether the model fits.
Lesson moves
Ways to Teach It
Give pairs graph paper, six data points, and a candidate line; students calculate residuals and place sticky dots on a residual plot.
Show two residual plots and ask, "Which linear model fits better, and what pattern supports your choice?"
Play Residual Match: students match scatter plots, linear equations, and residual plots, then check each set with a calculator.
Use temperature and electricity-use data to test whether a proposed linear model predicts usage without a systematic residual pattern.
Free download
Printable MA.912.DP.2.5 Worksheet
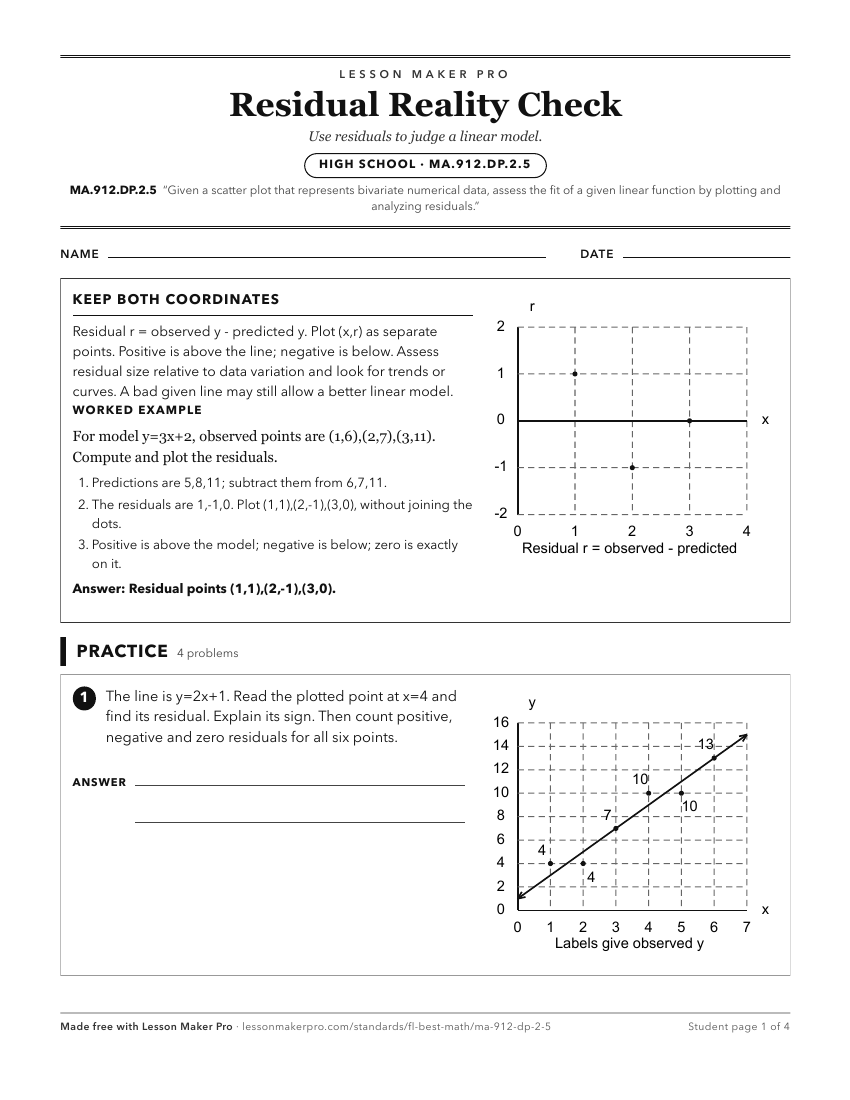
A ready-to-print activity worksheet aligned to MA.912.DP.2.5, with an answer key for the teacher on its own page. No account needed.
PDF, US Letter, prints cleanly in black and white.
Download the worksheetKeep exploring
Related Standards
- MA.912.DP.2.6
Given a scatter plot with a line of fit and residuals, determine the strength and direction of the correlation. Interpret strength and direction within a real-w...
- MA.8.DP.1.3
Given a scatter plot with a linear association, informally fit a straight line.
- MA.912.DP.2.4
Fit a linear function to bivariate numerical data that suggests a linear association and interpret the slope and y-intercept of the model. Use the model to solv...
- MA.8.DP.1.1
Given a set of real-world bivariate numerical data, construct a scatter plot or a line graph as appropriate for the context.
Turn this exact standard into a lesson
Grade, subject, topic, and the complete standard are prefilled. Create one free, no account needed.
Also for this standard:Make a WorksheetMake a QuizMake a Sub Lesson