Florida B.E.S.T. MA.912.DP.2.6
The Standard
Given a scatter plot with a line of fit and residuals, determine the strength and direction of the correlation. Interpret strength and direction within a real-world context.
Florida B.E.S.T. Standards for Mathematics
Teacher's field guide
What This Standard Means
What Students Need to Do
- Students use the slope of a fit line to identify positive or negative correlation. They use residuals to judge strength and explain the relationship using the variables in the situation.
What Mastery Looks Like
- Students identify positive or negative direction from the line’s slope. They use residual size and point clustering to describe strength, then explain the relationship without claiming causation.
Common Misconceptions
- Students may judge strength by how steep the line is instead of how closely points cluster around it. They may confuse positive residuals with positive correlation or claim that correlation proves causation.
How to Assess It
- Exit ticket: A study-time and test-score graph has a rising fit line and mostly small residuals. Name the correlation and interpret it in context.
Lesson moves
Ways to Teach It
Plot paired data on graph paper, place string along the fit line, and measure each point’s vertical residual with a ruler.
Ask students to explain why a steep line can show weak correlation and a gently rising line can show strong correlation.
Give groups scatter plot cards to sort by positive or negative direction and strong or weak correlation, then defend each placement.
Graph daily temperature and electricity use, fit a line, examine residuals, and describe what the relationship means for local energy demand.
Free download
Printable MA.912.DP.2.6 Worksheet
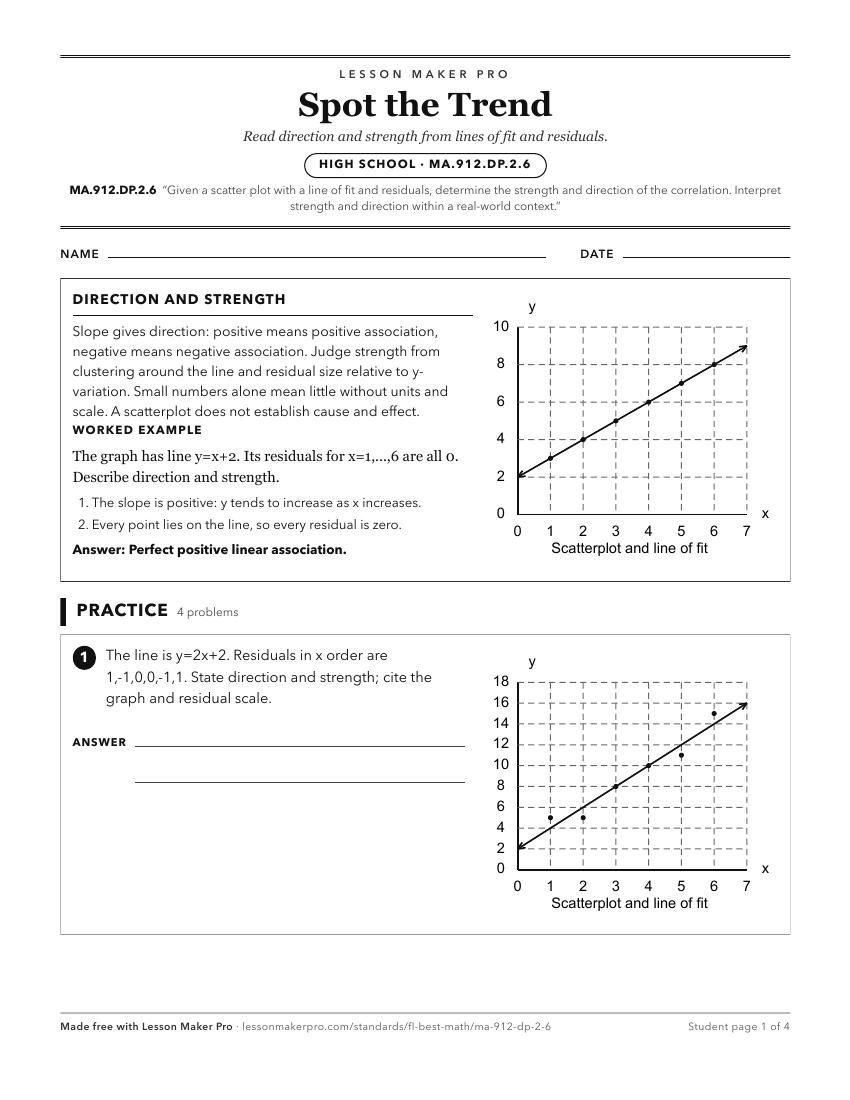
A ready-to-print activity worksheet aligned to MA.912.DP.2.6, with an answer key for the teacher on its own page. No account needed.
PDF, US Letter, prints cleanly in black and white.
Download the worksheetKeep exploring
Related Standards
- MA.8.DP.1.3
Given a scatter plot with a linear association, informally fit a straight line.
- MA.912.DP.2.7
Compute the correlation coefficient of a linear model using technology. Interpret the strength and direction of the correlation coefficient.
- MA.8.DP.1.2
Given a scatter plot within a real-world context, describe patterns of association.
- MA.912.DP.2.5
Given a scatter plot that represents bivariate numerical data, assess the fit of a given linear function by plotting and analyzing residuals.
Turn this exact standard into a lesson
Grade, subject, topic, and the complete standard are prefilled. Create one free, no account needed.
Also for this standard:Make a WorksheetMake a QuizMake a Sub Lesson