Florida B.E.S.T. MA.8.DP.1.2
The Standard
Given a scatter plot within a real-world context, describe patterns of association.
Florida B.E.S.T. Standards for Mathematics
Teacher's field guide
What This Standard Means
What Students Need to Do
- Students examine how two numerical variables change together on a graph. They describe the direction and form, then note the strength, clusters, and outliers in the given context.
What Mastery Looks Like
- A student can explain whether one variable generally increases, decreases, or shows no clear change as the other increases. They can identify linear or curved patterns and use clusters, spacing, and outliers as evidence.
Common Misconceptions
- Students may think a negative association requires negative values, rather than a downward trend. They may let one outlier define the trend or claim that association proves one variable causes the other.
How to Assess It
- Sketch a scatter plot labeled outside temperature and hot chocolate sales, with points close to a downward-sloping line and one outlier. Ask students to describe the direction, form, strength, and outlier in context.
Lesson moves
Ways to Teach It
Have pairs measure classmates' hand spans and heights, add points to a class scatter plot, and describe the overall pattern.
Show a scatter plot of sleep hours and reaction time, then ask students to write one claim supported by two graph features.
Run a card sort matching scatter plots to labels for positive, negative, no association, linear, nonlinear, cluster, and outlier.
Use a weather and cold-drink sales scatter plot to discuss the trend, exceptions, and why association does not prove cause.
Free download
Printable MA.8.DP.1.2 Worksheet
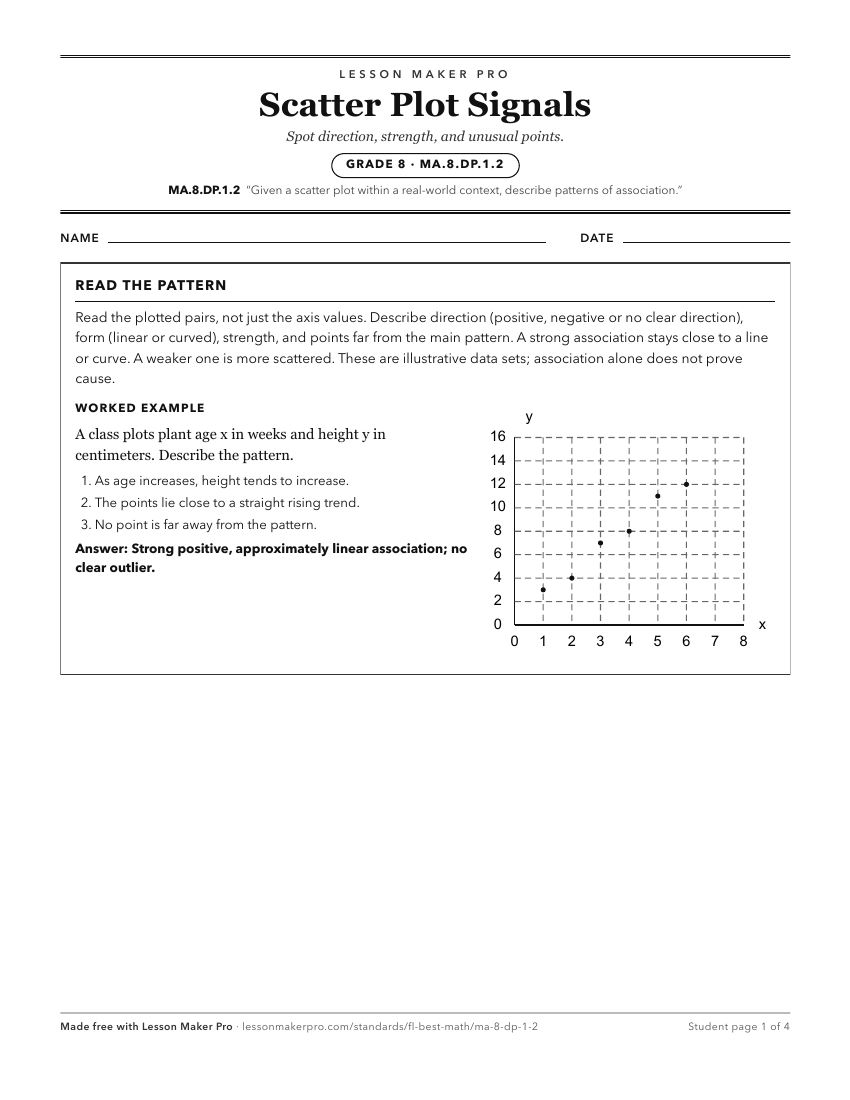
A ready-to-print activity worksheet aligned to MA.8.DP.1.2, with an answer key for the teacher on its own page. No account needed.
PDF, US Letter, prints cleanly in black and white.
Download the worksheetKeep exploring
Related Standards
- MA.912.DP.2.6
Given a scatter plot with a line of fit and residuals, determine the strength and direction of the correlation. Interpret strength and direction within a real-w...
- MA.8.DP.1.3
Given a scatter plot with a linear association, informally fit a straight line.
- MA.6.DP.1.4
Given a histogram or line plot within a real-world context, qualitatively describe and interpret the spread and distribution of the data, including any symmetry...
- MA.8.DP.1.1
Given a set of real-world bivariate numerical data, construct a scatter plot or a line graph as appropriate for the context.
Turn this exact standard into a lesson
Grade, subject, topic, and the complete standard are prefilled. Create one free, no account needed.
Also for this standard:Make a WorksheetMake a QuizMake a Sub Lesson