Florida B.E.S.T. MA.8.DP.1.1
The Standard
Given a set of real-world bivariate numerical data, construct a scatter plot or a line graph as appropriate for the context.
Florida B.E.S.T. Standards for Mathematics
Teacher's field guide
What This Standard Means
What Students Need to Do
- Students organize paired numerical values, choose a graph type that fits how the data were collected, and set sensible axis scales. They plot each pair accurately, label both axes, and connect points only when order or continuity makes that meaningful.
What Mastery Looks Like
- Given a table and context, a student chooses a scatter plot for paired measurements across people or objects and a line graph for values tracked in sequence. The graph has accurate points, even scales, clear labels, and lines only where the context supports them.
Common Misconceptions
- Students often choose a line graph because the points form a pattern, then connect unrelated observations. They may reverse the axes, use uneven intervals, omit units, or treat each coordinate as two separate values.
How to Assess It
- Exit ticket: Six students studied for 1, 2, 2.5, 3, 4, and 5 hours and scored 62, 68, 73, 78, 85, and 91. Choose and draw the appropriate graph, label both axes, and explain why you did or did not connect the points.
Lesson moves
Ways to Teach It
Give pairs index cards with paper helicopter blade lengths and drop times, then have them build a scatter plot on grid paper.
Have students write whether shoe size and height points should be connected, then support their answer using the data context.
Run a graph sort where teams match eight context cards to scatter plot or line graph, then defend one disputed choice.
Students collect outdoor temperature every hour, graph it as a line graph, and describe when the fastest change occurred.
Free download
Printable MA.8.DP.1.1 Worksheet
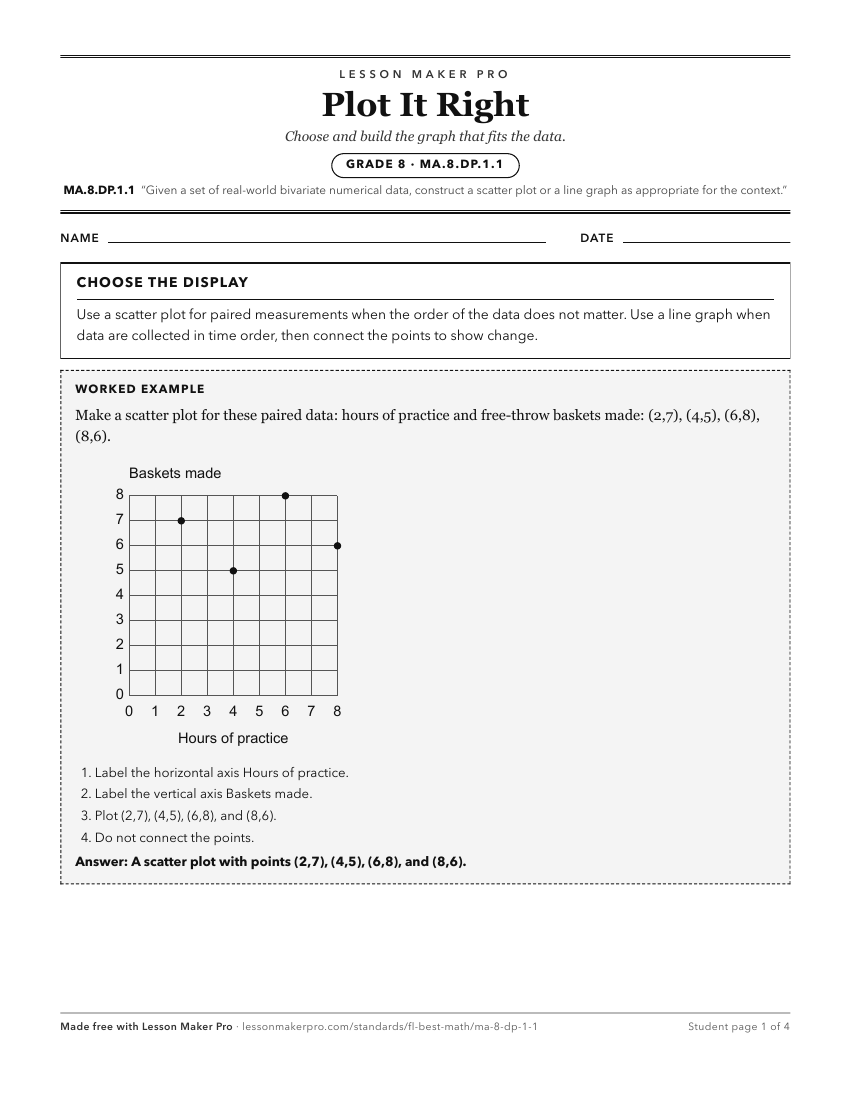
A ready-to-print activity worksheet aligned to MA.8.DP.1.1, with an answer key for the teacher on its own page. No account needed.
PDF, US Letter, prints cleanly in black and white.
Download the worksheetKeep exploring
Related Standards
- MA.8.DP.1
Represent and investigate numerical bivariate data.
- MA.912.DP.1.1
Given a set of data, select an appropriate method to represent the data, depending on whether it is numerical or categorical data and on whether it is univariat...
- MA.6.DP.1.5
Create box plots and histograms to represent sets of numerical data within real-world contexts.
- MA.7.DP.1.5
Given a real-world numerical or categorical data set, choose and create an appropriate graphical representation.
Turn this exact standard into a lesson
Grade, subject, topic, and the complete standard are prefilled. Create one free, no account needed.
Also for this standard:Make a WorksheetMake a QuizMake a Sub Lesson