Florida B.E.S.T. MA.7.DP.1.5
The Standard
Given a real-world numerical or categorical data set, choose and create an appropriate graphical representation.
Florida B.E.S.T. Standards for Mathematics
Teacher's field guide
What This Standard Means
What Students Need to Do
- Students identify whether data are categorical or numerical, then select a graph that fits the data and the question. They create the graph with accurate values, labels, and scale.
What Mastery Looks Like
- A student correctly classifies the data and chooses a display that makes the pattern easy to see. The graph has an accurate scale, labels, a title, and correctly plotted values. The student can explain why the graph fits the data.
Common Misconceptions
- Students may choose a graph because it looks familiar rather than because it fits the data. They often confuse bar graphs with histograms or add gaps between numerical intervals. Uneven scales, missing labels, and inaccurate frequencies can distort the results.
How to Assess It
- Give this exit ticket: Pet preferences are dog 12, cat 8, fish 4, and none 6. Choose and draw a suitable graph, then justify your choice in one sentence.
Lesson moves
Ways to Teach It
Build a human bar graph with students holding category cards, then transfer the class counts to a labeled paper graph.
Show a bar graph and histogram, then have partners explain which type of data each display fits and why.
Play a card sort matching data sets, graph types, and sample displays, then have teams defend one match.
Survey classmates about commute method and travel time, then create separate graphs for the categorical and numerical results.
Free download
Printable MA.7.DP.1.5 Worksheet
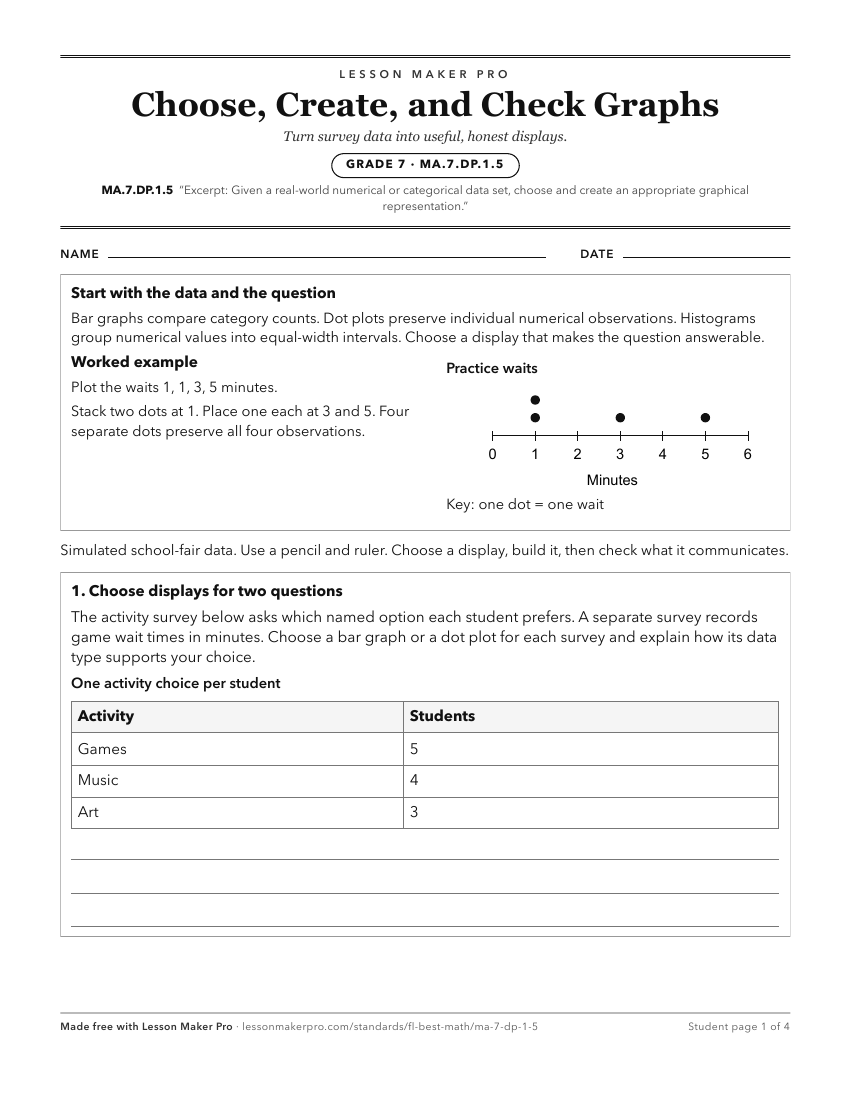
A ready-to-print activity worksheet aligned to MA.7.DP.1.5, with an answer key for the teacher on its own page. No account needed.
PDF, US Letter, prints cleanly in black and white.
Download the worksheetKeep exploring
Related Standards
- MA.912.DP.1.1
Given a set of data, select an appropriate method to represent the data, depending on whether it is numerical or categorical data and on whether it is univariat...
- MA.3.DP.1.1
Collect and represent numerical and categorical data with whole-number values using tables, scaled pictographs, scaled bar graphs or line plots. Use appropriate...
- MA.8.DP.1.1
Given a set of real-world bivariate numerical data, construct a scatter plot or a line graph as appropriate for the context.
- MA.7.DP.1
Represent and interpret numerical and categorical data.
Turn this exact standard into a lesson
Grade, subject, topic, and the complete standard are prefilled. Create one free, no account needed.
Also for this standard:Make a WorksheetMake a QuizMake a Sub Lesson