Florida B.E.S.T. MA.3.DP.1.1
The Standard
Collect and represent numerical and categorical data with whole-number values using tables, scaled pictographs, scaled bar graphs or line plots. Use appropriate titles, labels and units.
Florida B.E.S.T. Standards for Mathematics
Teacher's field guide
What This Standard Means
What Students Need to Do
- Students collect whole-number data by counting categories or recording numerical values. They organize the data in tables, pictographs, bar graphs, or line plots with clear titles, labels, scales, and units.
What Mastery Looks Like
- Students accurately organize collected data in a table and show the same data in a graph or line plot. Their work has a correct scale, title, labels, units, and key when needed.
Common Misconceptions
- Students may count each picture as one even when the key gives a different value. They may use uneven scale intervals, misplace values on line plots, or leave out titles, labels, and units.
How to Assess It
- Give each student 4 red, 6 blue, and 2 green counters. Ask them to sort, count, make a table, and draw a pictograph with a key of one symbol equals two counters.
Lesson moves
Ways to Teach It
Have groups sort colored counters, record category totals in a table, and create a scaled bar graph on grid paper.
Show two graphs of the same data and ask students to write which is easier to read and why.
Play Graph Match by having students pair data tables with scaled pictographs, bar graphs, or line plots posted around the room.
Survey classmates about lunch choices, tally the results, and create a scaled pictograph for a cafeteria manager.
Free download
Printable MA.3.DP.1.1 Worksheet
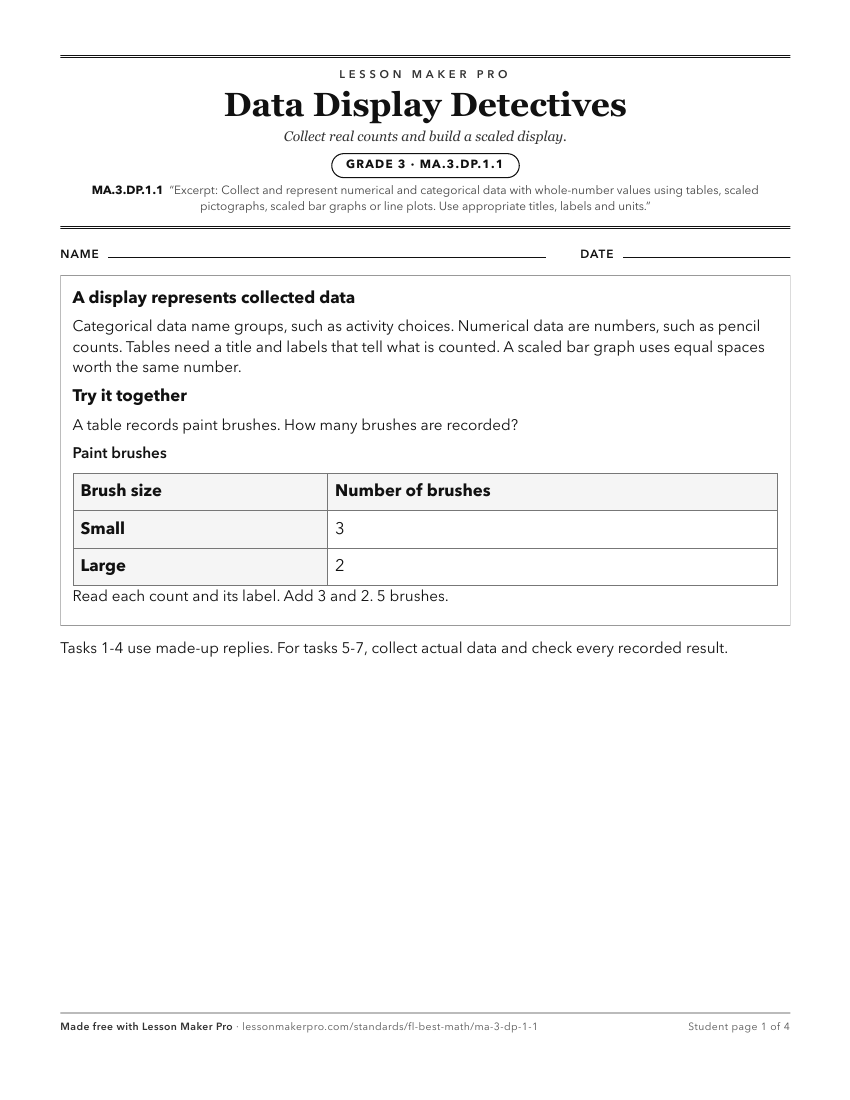
A ready-to-print activity worksheet aligned to MA.3.DP.1.1, with an answer key for the teacher on its own page. No account needed.
PDF, US Letter, prints cleanly in black and white.
Download the worksheetKeep exploring
Related Standards
- MA.3.DP.1.2
Interpret data with whole-number values represented with tables, scaled pictographs, circle graphs, scaled bar graphs or line plots by solving one- and two-step...
- MA.5.DP.1.1
Collect and represent numerical data, including fractional and decimal values, using tables, line graphs or line plots.
- MA.4.DP.1.1
Collect and represent numerical data, including fractional values, using tables, stem-and-leaf plots or line plots.
- MA.2.DP.1.1
Collect, categorize and represent data using tally marks, tables, pictographs or bar graphs. Use appropriate titles, labels and units.
Turn this exact standard into a lesson
Grade, subject, topic, and the complete standard are prefilled. Create one free, no account needed.
Also for this standard:Make a WorksheetMake a QuizMake a Sub Lesson