Florida B.E.S.T. MA.4.DP.1.1
The Standard
Collect and represent numerical data, including fractional values, using tables, stem-and-leaf plots or line plots.
Florida B.E.S.T. Standards for Mathematics
Teacher's field guide
What This Standard Means
What Students Need to Do
- Students gather numerical measurements or survey results and organize every value in a table. They create a stem-and-leaf plot or line plot with clear labels, equal spacing, and a key when needed.
What Mastery Looks Like
- Given whole-number and fractional data, a student chooses a suitable display and plots every value accurately. Labels, scale marks, frequency marks, and keys are clear enough to reconstruct the data.
Common Misconceptions
- Students may mark repeated values only once instead of showing each occurrence. They may order fractions incorrectly, use uneven spacing, or confuse stems with leaves.
How to Assess It
- Exit ticket: Show 1/4, 1/2, 1/2, 3/4, 1, and 1 in a table and a labeled line plot.
Lesson moves
Ways to Teach It
Measure classmates' pencil lengths to the nearest quarter inch, record results in a table, then build a class line plot.
Show a table and line plot of the same data, then ask students to explain how they know both displays match.
Give pairs data cards and display cards; students match each table, stem-and-leaf plot, or line plot to its data set.
Record water used to fill classroom bottles in quarter-cup units, then display the measurements on a line plot.
Free download
Printable MA.4.DP.1.1 Worksheet
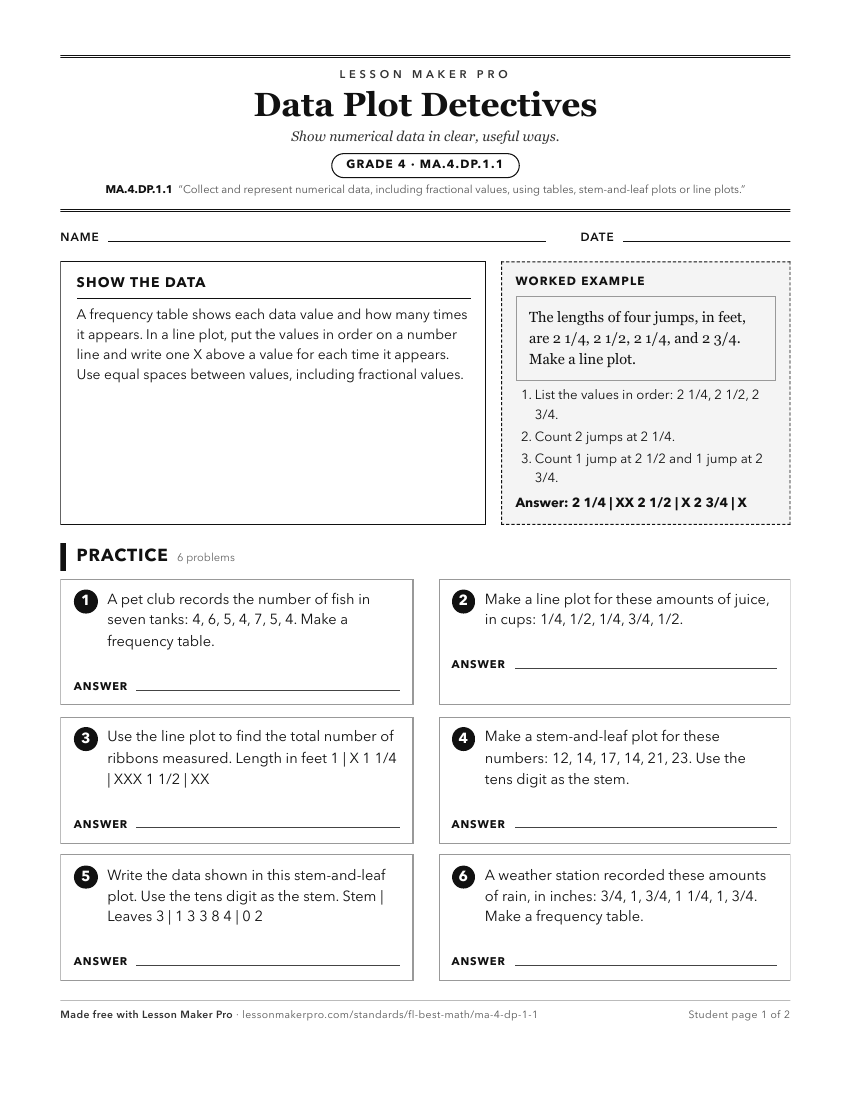
A ready-to-print activity worksheet aligned to MA.4.DP.1.1, with an answer key for the teacher on its own page. No account needed.
PDF, US Letter, prints cleanly in black and white.
Download the worksheetKeep exploring
Related Standards
- MA.5.DP.1.1
Collect and represent numerical data, including fractional and decimal values, using tables, line graphs or line plots.
- MA.3.DP.1.1
Collect and represent numerical and categorical data with whole-number values using tables, scaled pictographs, scaled bar graphs or line plots. Use appropriate...
- MA.4.DP.1.2
Determine the mode, median or range to interpret numerical data including fractional values, represented with tables, stem-and-leaf plots or line plots.
- MA.3.DP.1
Collect, represent and interpret numerical and categorical data.
Turn this exact standard into a lesson
Grade, subject, topic, and the complete standard are prefilled. Create one free, no account needed.
Also for this standard:Make a WorksheetMake a QuizMake a Sub Lesson