Florida B.E.S.T. MA.5.DP.1.1
The Standard
Collect and represent numerical data, including fractional and decimal values, using tables, line graphs or line plots.
Florida B.E.S.T. Standards for Mathematics
Teacher's field guide
What This Standard Means
What Students Need to Do
- Students collect numerical measurements or survey results that include fractions and decimals. They organize the data in tables, line graphs, or line plots using accurate scales, labels, and intervals.
What Mastery Looks Like
- Students organize fractional or decimal data in a clear table and select a suitable graph. They use equal intervals, accurate labels, and correctly show every data value.
Common Misconceptions
- Students may choose uneven intervals, skip labels, or place values between the wrong tick marks. They may also confuse a line plot, which shows frequency, with a line graph, which shows change over time.
How to Assess It
- Give students the data 1.25, 1.5, 1.25, 1.75, 1.5, and 1.25. Ask them to organize it in a table and make a labeled line plot.
Lesson moves
Ways to Teach It
Have students measure five classroom objects to the nearest tenth centimeter, record the results in a table, and create a line plot.
Ask students to explain in writing whether a line graph or line plot better represents daily temperatures and why.
Play Graph Match by having pairs match decimal data cards with the correct table, line graph, or line plot.
Track one week of daily rainfall amounts, then organize the decimal measurements in a table and graph changes across the week.
Free download
Printable MA.5.DP.1.1 Worksheet
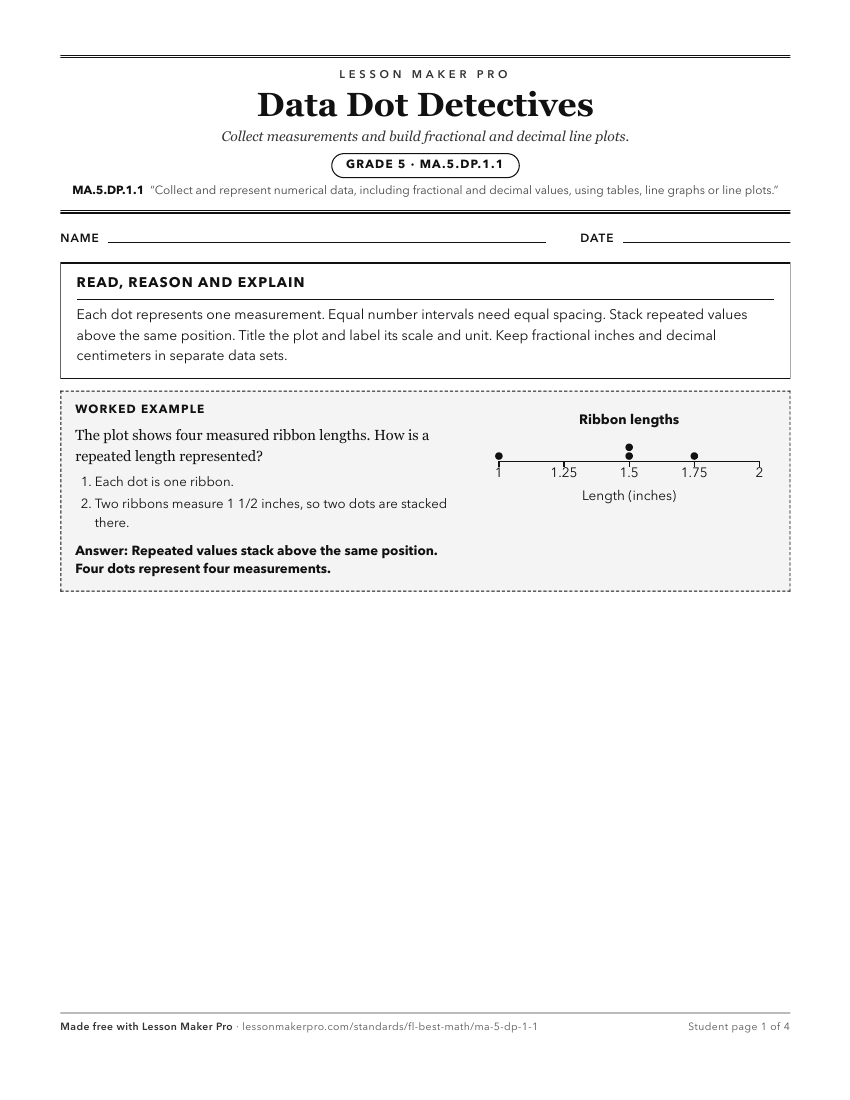
A ready-to-print activity worksheet aligned to MA.5.DP.1.1, with an answer key for the teacher on its own page. No account needed.
PDF, US Letter, prints cleanly in black and white.
Download the worksheetKeep exploring
Related Standards
- MA.4.DP.1.1
Collect and represent numerical data, including fractional values, using tables, stem-and-leaf plots or line plots.
- MA.2.DP.1.1
Collect, categorize and represent data using tally marks, tables, pictographs or bar graphs. Use appropriate titles, labels and units.
- MA.3.DP.1.1
Collect and represent numerical and categorical data with whole-number values using tables, scaled pictographs, scaled bar graphs or line plots. Use appropriate...
- MA.3.DP.1
Collect, represent and interpret numerical and categorical data.
Turn this exact standard into a lesson
Grade, subject, topic, and the complete standard are prefilled. Create one free, no account needed.
Also for this standard:Make a WorksheetMake a QuizMake a Sub Lesson