Florida B.E.S.T. MA.2.DP.1.1
The Standard
Collect, categorize and represent data using tally marks, tables, pictographs or bar graphs. Use appropriate titles, labels and units.
Florida B.E.S.T. Standards for Mathematics
Teacher's field guide
What This Standard Means
What Students Need to Do
- Students gather information from objects, observations, or simple survey questions. They sort the results into categories and show the counts clearly so another person can read the data.
What Mastery Looks Like
- Students record each response once and organize the results into clear groups. They create an accurate table, pictograph, or bar graph with a useful title, labels, and consistent units.
Common Misconceptions
- Students may count one item twice, skip items, or place an item in the wrong group. They may omit a title, mix up category labels and numbers, or draw unequal bar widths. In pictographs, they may ignore the value of each picture.
How to Assess It
- Give students the data: cats 6, dogs 4, fish 2. Ask them to create a labeled bar graph with a title and write which pet received the most votes.
Lesson moves
Ways to Teach It
Give pairs a cup of colored counters to sort, tally, and display in a bar graph with a title and labels.
Show a graph missing its title and labels, then ask students to write what should be added and explain why.
Partners draw category cards, add tally marks to a recording sheet, and race to build an accurate graph after 20 draws.
Survey classmates about favorite playground activities, then create a class pictograph to help plan extra recess equipment.
Free download
Printable MA.2.DP.1.1 Worksheet
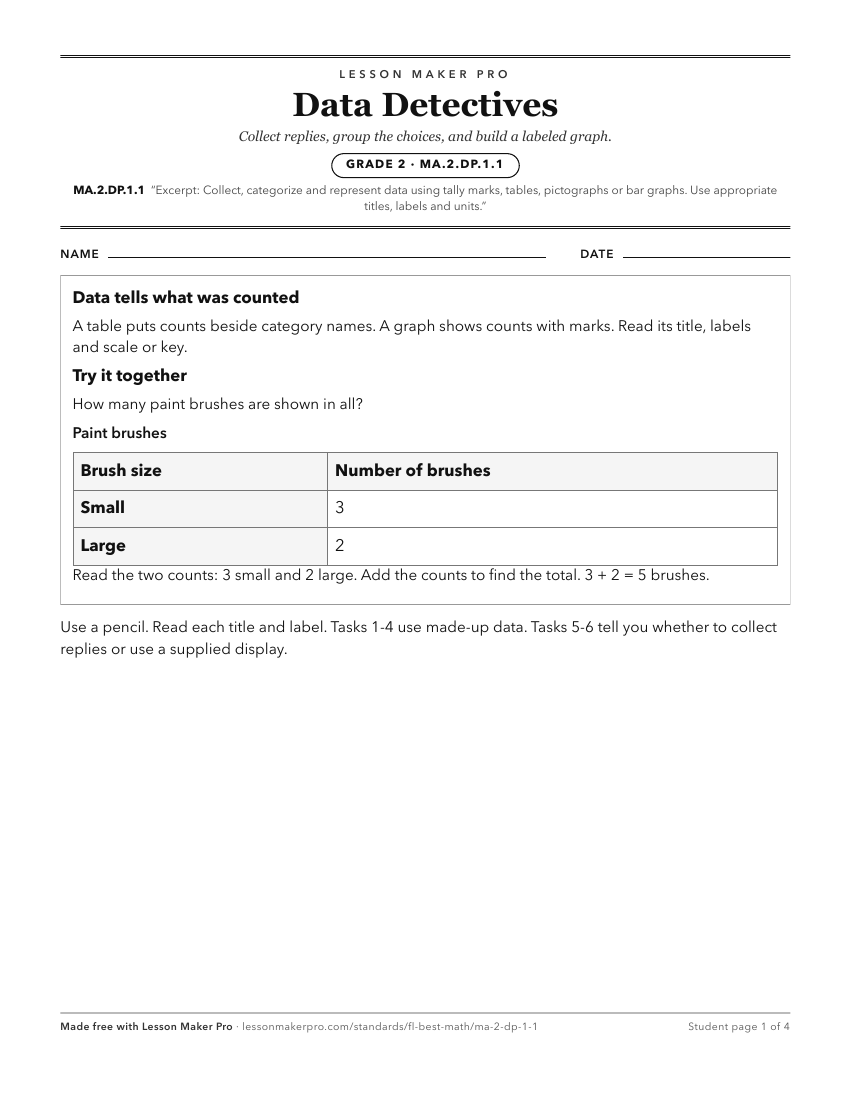
A ready-to-print activity worksheet aligned to MA.2.DP.1.1, with an answer key for the teacher on its own page. No account needed.
PDF, US Letter, prints cleanly in black and white.
Download the worksheetKeep exploring
Related Standards
- MA.1.DP.1.1
Collect data into categories and represent the results using tally marks or pictographs.
- MA.1.DP.1
Collect, represent and interpret data using pictographs and tally marks.
- MA.3.DP.1.1
Collect and represent numerical and categorical data with whole-number values using tables, scaled pictographs, scaled bar graphs or line plots. Use appropriate...
- MA.2.DP.1
Collect, categorize, represent and interpret data using appropriate titles, labels and units.
Turn this exact standard into a lesson
Grade, subject, topic, and the complete standard are prefilled. Create one free, no account needed.
Also for this standard:Make a WorksheetMake a QuizMake a Sub Lesson