Florida B.E.S.T. MA.1.DP.1
B.E.S.T. Standard (Benchmark Cluster)
Collect, represent and interpret data using pictographs and tally marks.
Florida B.E.S.T. Standards for Mathematics
Cluster contents
Benchmarks in This Standard
MA.1.DP.1 is a B.E.S.T. standard. These are the benchmarks under it.
Teacher's field guide
What This Cluster Means
What Students Need to Do
- Students gather simple data, such as classmates' favorite fruits, and record each response with tally marks. They turn the counts into a pictograph and use it to compare categories.
What Mastery Looks Like
- Students record each response once using correct tally marks. They make a matching pictograph and answer questions about totals, most, least, and differences.
Common Misconceptions
- Students may write five separate tally marks instead of crossing the first four with the fifth. They may skip pictures, add extras, or confuse most with least.
How to Assess It
- Give students the data red, blue, red, green, blue, red. Ask them to make a tally chart and pictograph, then identify the color chosen most.
Lesson moves
Ways to Teach It
Give pairs 12 colored cubes; students sort them, record tally marks, then draw one matching picture for each cube.
Display a snack pictograph and ask, "Which snack has the most votes, and how do you know?"
Play Data Detective: partners draw a card with a tally chart, build its pictograph, and check each other's counts.
Track five days of weather with daily tallies, then make a pictograph showing sunny, cloudy, and rainy days.
Free download
Printable MA.1.DP.1 Worksheet
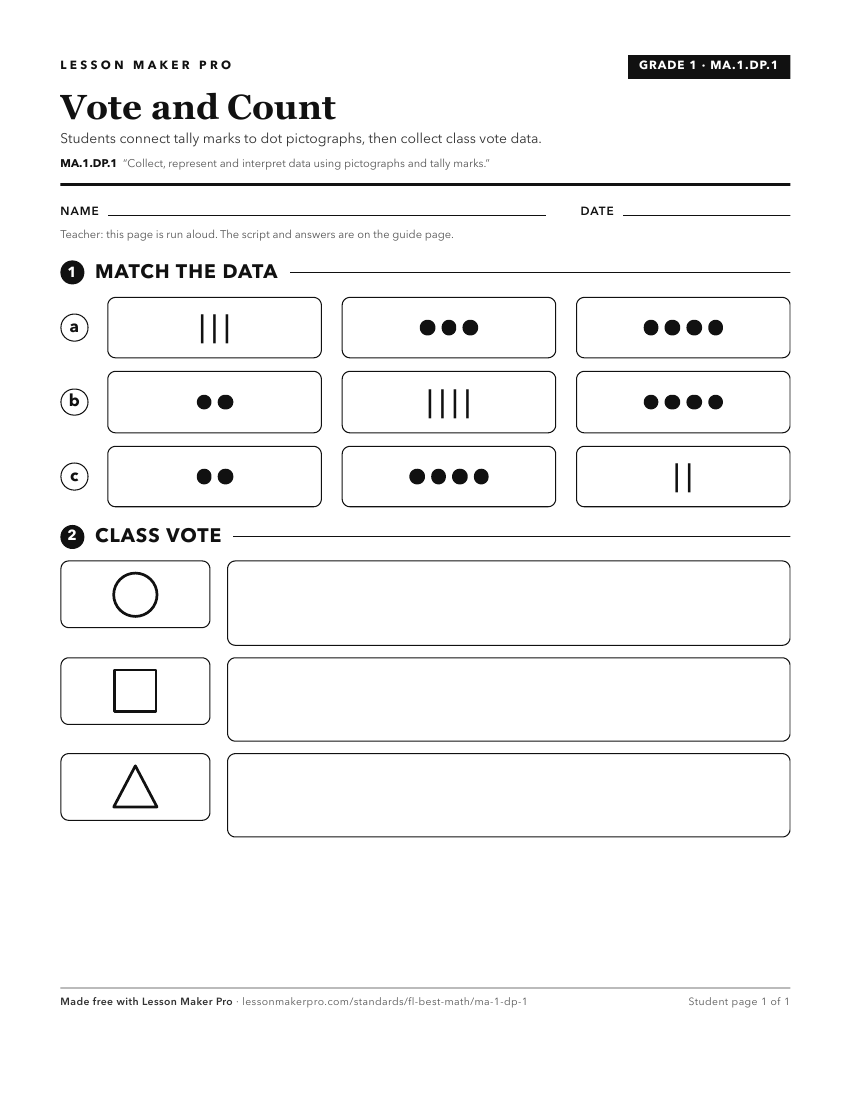
A ready-to-print activity worksheet aligned to MA.1.DP.1, with an answer key for the teacher on its own page. No account needed.
PDF, US Letter, prints cleanly in black and white.
Download the worksheetKeep exploring
Related Standards
- MA.2.DP.1.1
Collect, categorize and represent data using tally marks, tables, pictographs or bar graphs. Use appropriate titles, labels and units.
- MA.3.DP.1.1
Collect and represent numerical and categorical data with whole-number values using tables, scaled pictographs, scaled bar graphs or line plots. Use appropriate...
Turn this cluster into a lesson
Grade, subject, topic, and the complete cluster are prefilled. Create one free, no account needed.
Also for this cluster:Make a WorksheetMake a QuizMake a Sub Lesson