Florida B.E.S.T. MA.1.DP.1.2
The Standard
Interpret data represented with tally marks or pictographs by calculating the total number of data points and comparing the totals of different categories.
Florida B.E.S.T. Standards for Mathematics
Teacher's field guide
What This Standard Means
What Students Need to Do
- Students count tally marks and picture symbols to find totals for each category and the whole set. They compare categories to identify more, fewer, or equal amounts.
What Mastery Looks Like
- Students correctly count tally marks and picture symbols, including groups of five. They find each category total, find the total for the whole chart, and compare categories using more, fewer, or equal.
Common Misconceptions
- Students may count the diagonal fifth tally as an extra mark or count tally groups instead of individual marks. They may compare pictures by size rather than counting each symbol.
How to Assess It
- Show a pictograph with 5 cats, 3 dogs, and 4 fish. Ask, “How many animals are shown altogether, and how many more cats than dogs?”
Lesson moves
Ways to Teach It
Survey classmates about favorite fruits, record each vote with a tally mark, then count and compare the categories.
Show a three-category pictograph and ask students to write which category has the most and how they know.
Play Data Detective by giving pairs tally charts and challenge cards asking for totals, greatest categories, and differences.
Track three classroom cleanup jobs for one week with picture symbols, then compare how often each job was completed.
Free download
Printable MA.1.DP.1.2 Worksheet
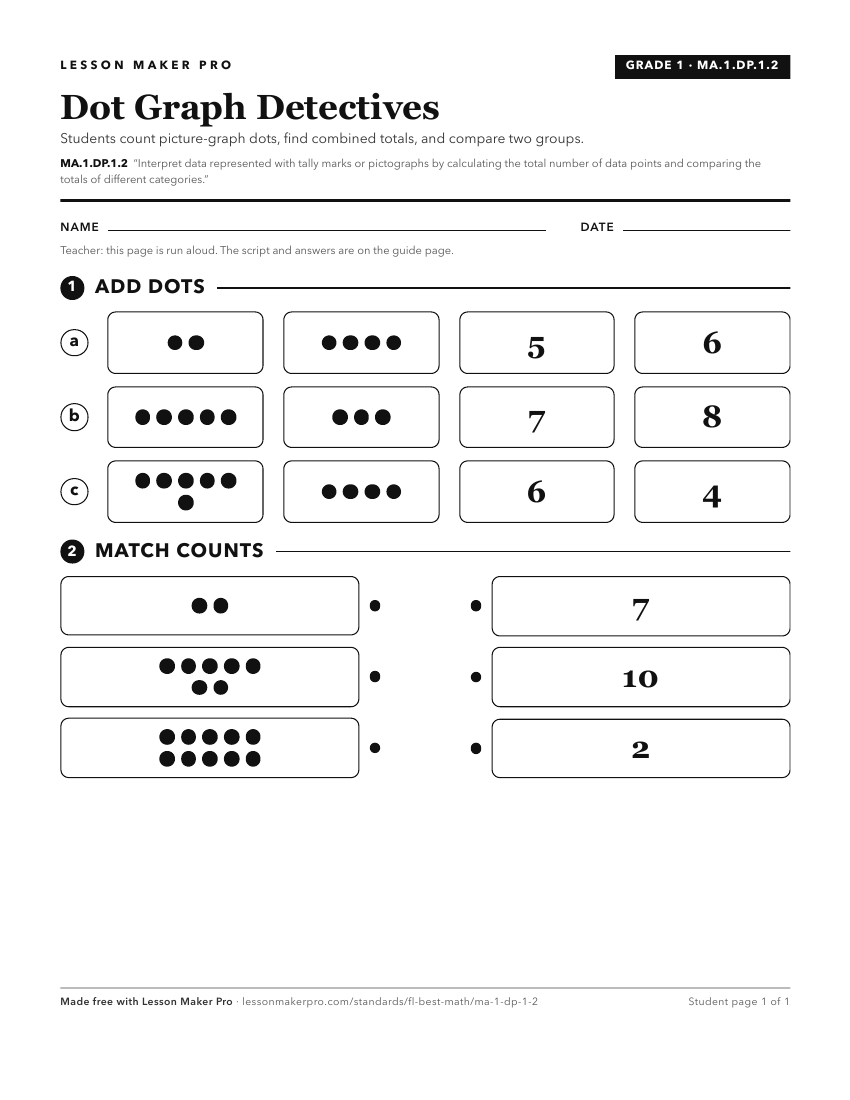
A ready-to-print activity worksheet aligned to MA.1.DP.1.2, with an answer key for the teacher on its own page. No account needed.
PDF, US Letter, prints cleanly in black and white.
Download the worksheetKeep exploring
Related Standards
- MA.1.DP.1.1
Collect data into categories and represent the results using tally marks or pictographs.
- MA.1.DP.1
Collect, represent and interpret data using pictographs and tally marks.
- MA.2.DP.1.1
Collect, categorize and represent data using tally marks, tables, pictographs or bar graphs. Use appropriate titles, labels and units.
- MA.2.DP.1.2
Interpret data represented with tally marks, tables, pictographs or bar graphs including solving addition and subtraction problems.
Turn this exact standard into a lesson
Grade, subject, topic, and the complete standard are prefilled. Create one free, no account needed.
Also for this standard:Make a WorksheetMake a QuizMake a Sub Lesson