Florida B.E.S.T. MA.1.DP.1.1
The Standard
Collect data into categories and represent the results using tally marks or pictographs.
Florida B.E.S.T. Standards for Mathematics
Teacher's field guide
What This Standard Means
What Students Need to Do
- Students gather information by asking a question or sorting objects into groups. They record how many are in each group with tally marks or pictures. Each mark or picture must match one item.
What Mastery Looks Like
- A student sorts each response or object into the correct category and records every item once. Their tallies or pictures match the category totals and can be counted easily.
Common Misconceptions
- Students may draw one picture for a whole category instead of one picture for each item. They may count the fifth tally as a separate mark instead of crossing four marks. Some mix categories or record the same item twice.
How to Assess It
- Give each student eight colored counters. Ask them to sort the counters by color and show the results with tally marks or a pictograph.
Lesson moves
Ways to Teach It
Give pairs a cup of colored cubes to sort, count, and record with tally marks.
Ask, "Which class pet would you choose?" Collect votes, then have students explain how to show the results.
Play Data Match by pairing category cards with the correct tally chart or pictograph.
Survey classmates about their usual way to school, then create a pictograph with one picture for each response.
Free download
Printable MA.1.DP.1.1 Worksheet
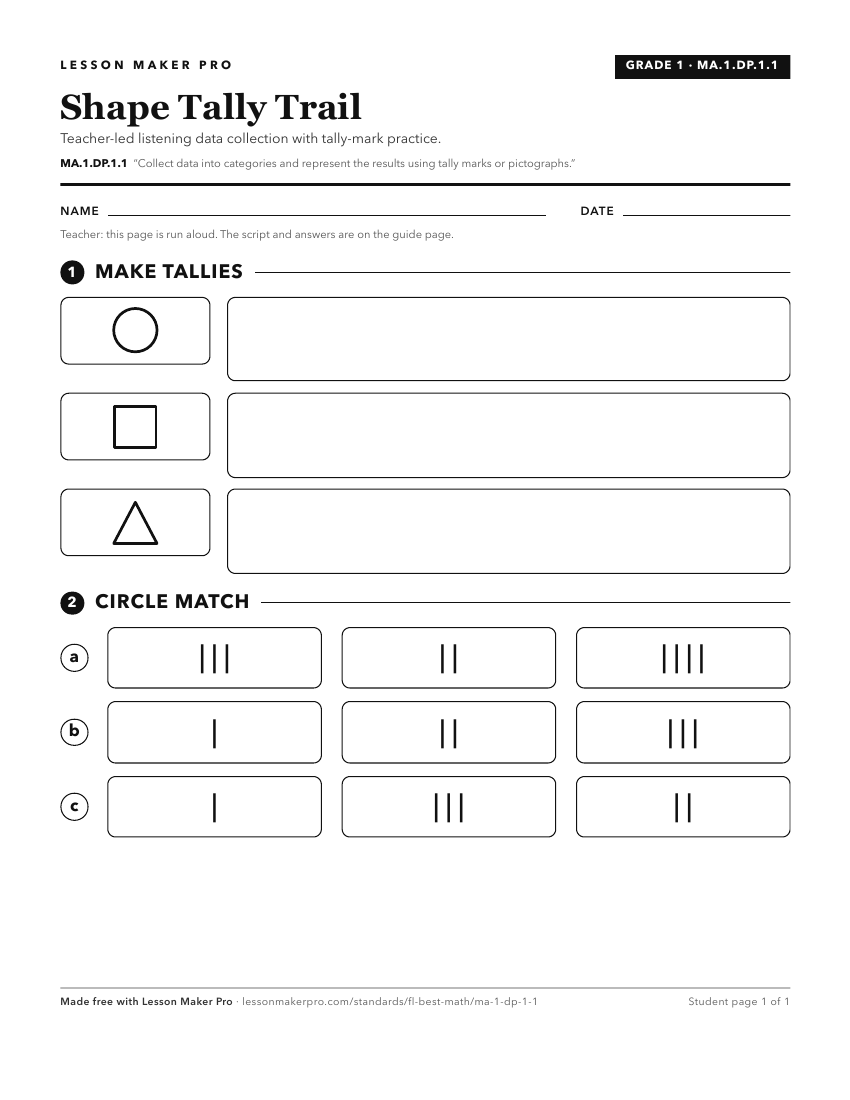
A ready-to-print activity worksheet aligned to MA.1.DP.1.1, with an answer key for the teacher on its own page. No account needed.
PDF, US Letter, prints cleanly in black and white.
Download the worksheetKeep exploring
Related Standards
- MA.K.DP.1.1
Collect and sort objects into categories and compare the categories by counting the objects in each category. Report the results verbally, with a written numera...
- MA.1.DP.1
Collect, represent and interpret data using pictographs and tally marks.
- MA.2.DP.1.1
Collect, categorize and represent data using tally marks, tables, pictographs or bar graphs. Use appropriate titles, labels and units.
- MA.1.DP.1.2
Interpret data represented with tally marks or pictographs by calculating the total number of data points and comparing the totals of different categories.
Turn this exact standard into a lesson
Grade, subject, topic, and the complete standard are prefilled. Create one free, no account needed.
Also for this standard:Make a WorksheetMake a QuizMake a Sub Lesson