Florida B.E.S.T. MA.2.DP.1
B.E.S.T. Standard (Benchmark Cluster)
Collect, categorize, represent and interpret data using appropriate titles, labels and units.
Florida B.E.S.T. Standards for Mathematics
Cluster contents
Benchmarks in This Standard
MA.2.DP.1 is a B.E.S.T. standard. These are the benchmarks under it.
Teacher's field guide
What This Cluster Means
What Students Need to Do
- Students gather answers or measurements, sort them into clear groups, and show the results in a table or graph. They add a useful title, label each category, name the unit, and use the display to answer questions.
What Mastery Looks Like
- Given a small data set, a student makes an accurate table, picture graph, or bar graph with a clear title, labels, and unit. The student uses the display to find totals, compare categories, and explain how many more or fewer.
Common Misconceptions
- Students may count tally marks incorrectly, especially the crossed group of five. They may assume each picture means one item and ignore the key. They may also omit labels or confuse a category name with the unit being counted.
How to Assess It
- Give students these fruit votes: apple 6, banana 4, orange 2. Ask them to graph the data and write how many more votes apple received than orange.
Lesson moves
Ways to Teach It
Give pairs 20 buttons to sort by color, record with tally marks, and build a labeled picture graph using one square per button.
Show an unlabeled graph and ask, “What information is missing, and what claims can we safely make from it?”
Play Data Detective: pairs draw question cards, read a graph, and earn a point for each answer supported with data.
Run a class vote on three read-aloud books, graph the votes, and use the results to choose tomorrow’s book.
Free download
Printable MA.2.DP.1 Worksheet
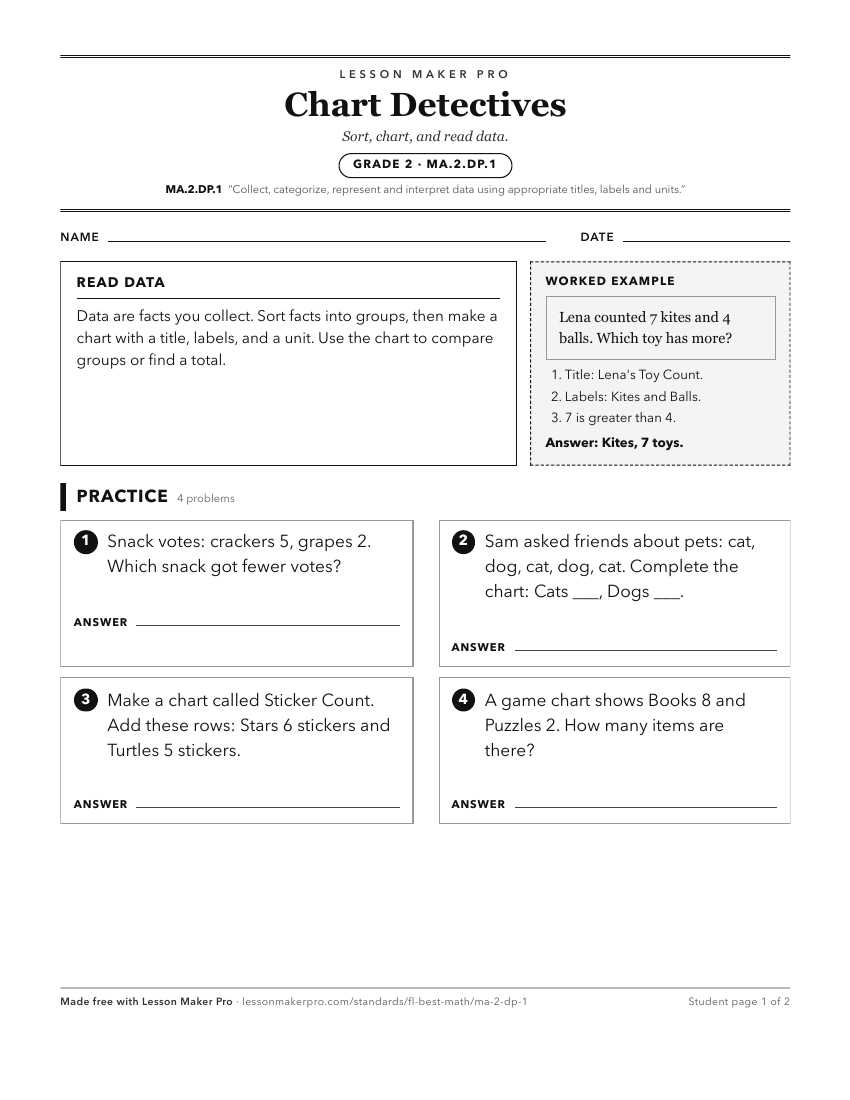
A ready-to-print activity worksheet aligned to MA.2.DP.1, with an answer key for the teacher on its own page. No account needed.
PDF, US Letter, prints cleanly in black and white.
Download the worksheetKeep exploring
Related Standards
- MA.K.DP.1
Develop an understanding for collecting, representing and comparing data.
- MA.3.DP.1.1
Collect and represent numerical and categorical data with whole-number values using tables, scaled pictographs, scaled bar graphs or line plots. Use appropriate...
- MA.3.DP.1
Collect, represent and interpret numerical and categorical data.
Turn this cluster into a lesson
Grade, subject, topic, and the complete cluster are prefilled. Create one free, no account needed.
Also for this cluster:Make a WorksheetMake a QuizMake a Sub Lesson