Florida B.E.S.T. MA.K.DP.1
B.E.S.T. Standard (Benchmark Cluster)
Develop an understanding for collecting, representing and comparing data.
Florida B.E.S.T. Standards for Mathematics
Cluster contents
Benchmarks in This Standard
MA.K.DP.1 is a B.E.S.T. standard. These are the benchmarks under it.
Teacher's field guide
What This Cluster Means
What Students Need to Do
- Students sort objects or responses into groups and show the results with objects, drawings, tally marks, or simple graphs. They count each group and compare which has more, fewer, or the same number.
What Mastery Looks Like
- A student sorts a small set, counts each group, and records the results with drawings or objects. The student correctly names which group has more, fewer, or the same number.
Common Misconceptions
- Students may count items incorrectly or place one item in two groups. They may think the tallest-looking picture graph column always has the most, even when pictures are not lined up.
How to Assess It
- Give students 10 colored counters. Ask them to sort by color, draw a picture graph, and circle the group with the most.
Lesson moves
Ways to Teach It
Have students sort a cup of buttons by color, line up each group, and compare the rows.
Show a class picture graph and ask, “Which choice has fewer votes, and how do you know?”
Play Data Detective by giving partners picture graphs and asking them to find the most, least, or equal groups.
Survey classmates about their favorite fruit, record each vote with a tally or picture, and compare the totals.
Free download
Printable MA.K.DP.1 Worksheet
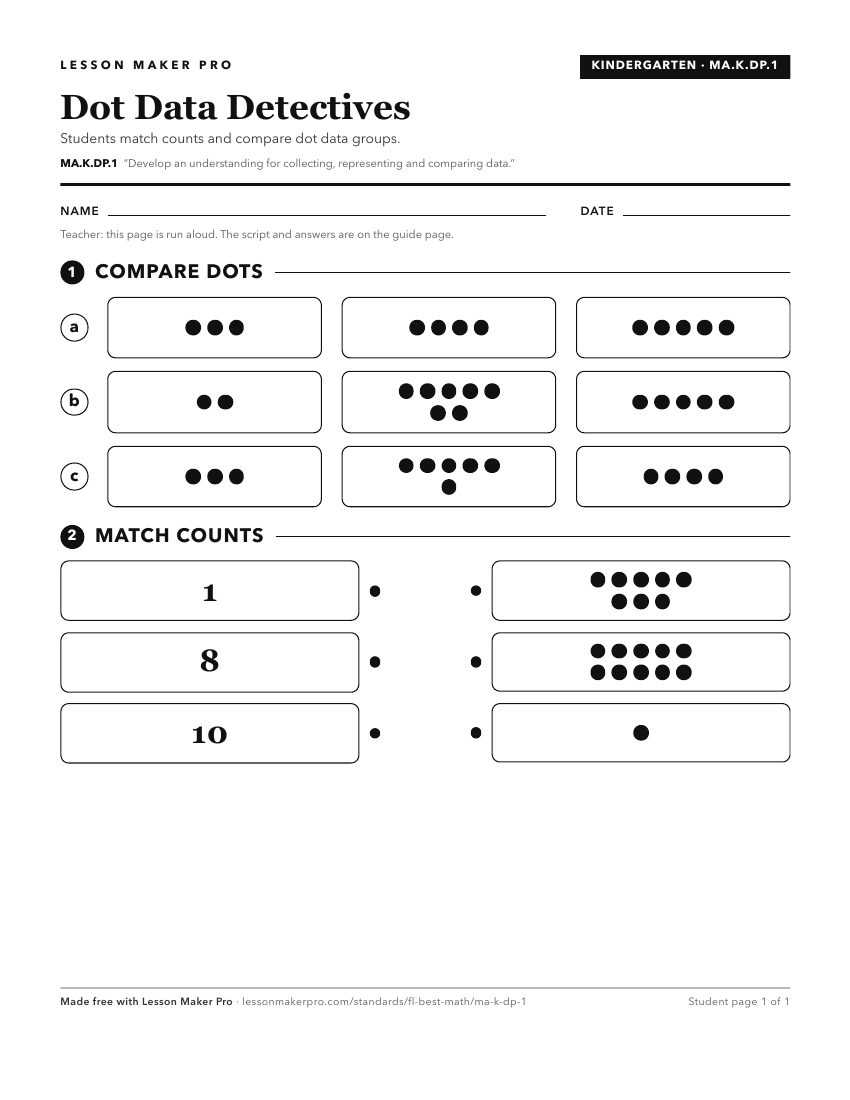
A ready-to-print activity worksheet aligned to MA.K.DP.1, with an answer key for the teacher on its own page. No account needed.
PDF, US Letter, prints cleanly in black and white.
Download the worksheetKeep exploring
Related Standards
- MA.5.DP.1
Collect, represent and interpret data and find the mean, mode, median or range of a data set.
- MA.3.DP.1
Collect, represent and interpret numerical and categorical data.
- MA.2.DP.1
Collect, categorize, represent and interpret data using appropriate titles, labels and units.
- MA.4.DP.1
Collect, represent and interpret data and find the mode, median and range of a data set.
Turn this cluster into a lesson
Grade, subject, topic, and the complete cluster are prefilled. Create one free, no account needed.
Also for this cluster:Make a WorksheetMake a QuizMake a Sub Lesson