Florida B.E.S.T. MA.4.DP.1
B.E.S.T. Standard (Benchmark Cluster)
Collect, represent and interpret data and find the mode, median and range of a data set.
Florida B.E.S.T. Standards for Mathematics
Cluster contents
Benchmarks in This Standard
MA.4.DP.1 is a B.E.S.T. standard. These are the benchmarks under it.
- MA.4.DP.1.1
Collect and represent numerical data, including fractional values, using tables, stem-and-leaf plots or line plots.
- MA.4.DP.1.2
Determine the mode, median or range to interpret numerical data including fractional values, represented with tables, stem-and-leaf plots or line plots.
- MA.4.DP.1.3
Solve real-world problems involving numerical data.
Teacher's field guide
What This Cluster Means
What Students Need to Do
- Students gather numerical data and organize it in a table or graph. They order the values, find the mode, median, and range, and explain what the data shows.
What Mastery Looks Like
- Given an unsorted data set, students order the values and correctly identify the mode, median, and range. They create an accurate display and use it to explain a pattern or comparison.
Common Misconceptions
- Students may choose the greatest value as the mode, skip ordering values before finding the median, or calculate range by counting entries. They may also assume every data set has exactly one mode.
How to Assess It
- Give students 3, 5, 5, 7, 10. Ask them to make a line plot, find the mode, median, and range, then write one observation.
Lesson moves
Ways to Teach It
Survey classmates on books read last month, build a sticky-note line plot, and calculate the mode, median, and range.
Compare 2, 4, 4, 6, 9 with 2, 3, 5, 7, 8, then write which set is more spread out and why.
In pairs, draw seven number cards, order them, and race to find each measure, earning one point for every correct answer.
Use seven days of local high temperatures to make a graph and explain how the median and range describe the week's weather.
Free download
Printable MA.4.DP.1 Worksheet
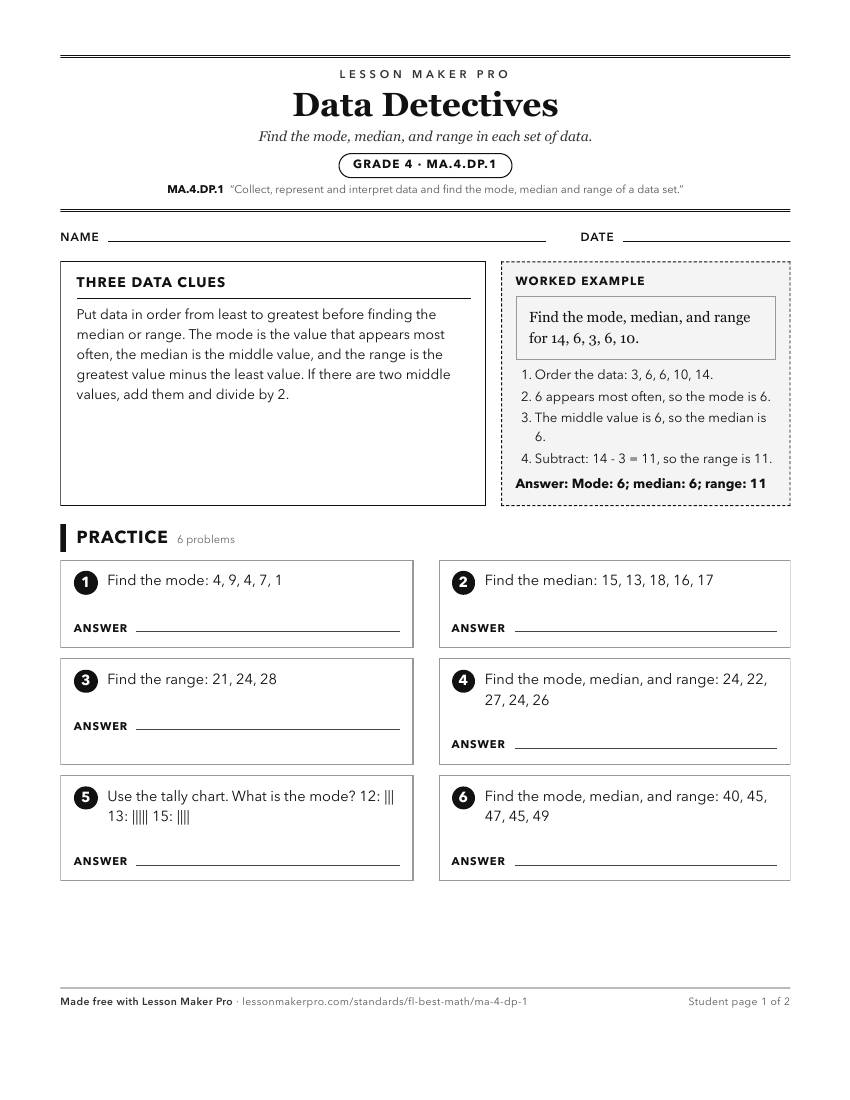
A ready-to-print activity worksheet aligned to MA.4.DP.1, with an answer key for the teacher on its own page. No account needed.
PDF, US Letter, prints cleanly in black and white.
Download the worksheetKeep exploring
Related Standards
- MA.5.DP.1.2
Interpret numerical data, with whole-number values, represented with tables or line plots by determining the mean, mode, median or range.
- MA.5.DP.1
Collect, represent and interpret data and find the mean, mode, median or range of a data set.
- MA.3.DP.1
Collect, represent and interpret numerical and categorical data.
- MA.6.DP.1.2
Given a numerical data set within a real-world context, find and interpret mean, median, mode and range.
Turn this cluster into a lesson
Grade, subject, topic, and the complete cluster are prefilled. Create one free, no account needed.
Also for this cluster:Make a WorksheetMake a QuizMake a Sub Lesson