Florida B.E.S.T. MA.3.DP.1.2
The Standard
Interpret data with whole-number values represented with tables, scaled pictographs, circle graphs, scaled bar graphs or line plots by solving one- and two-step problems.
Florida B.E.S.T. Standards for Mathematics
Teacher's field guide
What This Standard Means
What Students Need to Do
- Students read values from tables, graphs, pictographs, and line plots, paying attention to labels, keys, and scales. They use the data to solve questions that require one or two calculations.
What Mastery Looks Like
- Students read exact values from each display by using labels, keys, and scales. They choose the needed operations, complete both steps when required, and explain how the data supports their answer.
Common Misconceptions
- Students often count each picture or grid mark as one and ignore the scale or key. They may add when a question asks for a difference, or stop after only the first step. Some compare circle sections by shape without checking the labels or total.
How to Assess It
- Display a scaled bar graph with cats at 12, dogs at 8, and fish at 4, using a scale of 2. Ask, "How many more students chose cats and dogs together than fish? Show your work."
Lesson moves
Ways to Teach It
Have students survey shoe colors, build a table with counters, then make a scaled bar graph and write a two-step question.
Show the same class data in a table and circle graph; ask, "Which display makes comparisons easier, and what evidence supports your answer?"
Use matching cards with data displays, questions, and answers; teams earn a point only when they explain the scale and operations.
Give cafeteria sales totals for four lunch choices; students graph the counts and calculate how many more meals two choices sold together.
Free download
Printable MA.3.DP.1.2 Worksheet
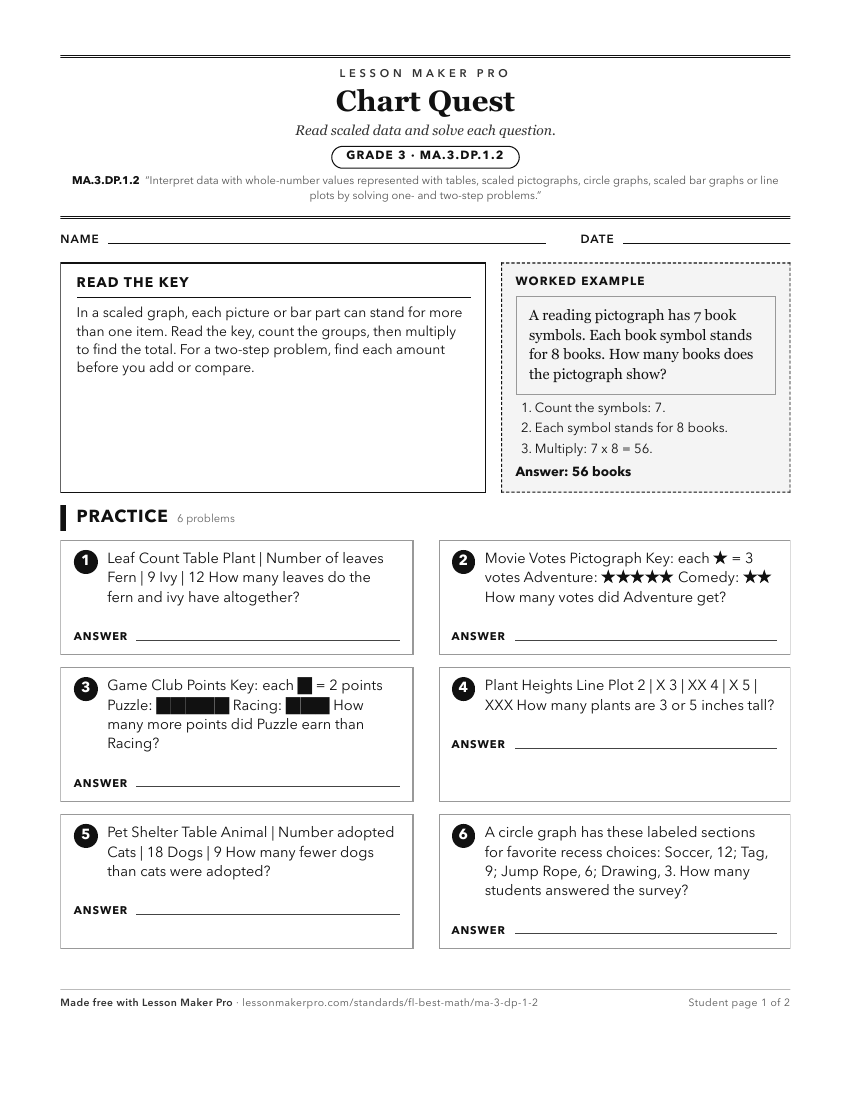
A ready-to-print activity worksheet aligned to MA.3.DP.1.2, with an answer key for the teacher on its own page. No account needed.
PDF, US Letter, prints cleanly in black and white.
Download the worksheetKeep exploring
Related Standards
- MA.5.DP.1.1
Collect and represent numerical data, including fractional and decimal values, using tables, line graphs or line plots.
- MA.4.DP.1.1
Collect and represent numerical data, including fractional values, using tables, stem-and-leaf plots or line plots.
- MA.3.DP.1.1
Collect and represent numerical and categorical data with whole-number values using tables, scaled pictographs, scaled bar graphs or line plots. Use appropriate...
- MA.2.DP.1.2
Interpret data represented with tally marks, tables, pictographs or bar graphs including solving addition and subtraction problems.
Turn this exact standard into a lesson
Grade, subject, topic, and the complete standard are prefilled. Create one free, no account needed.
Also for this standard:Make a WorksheetMake a QuizMake a Sub Lesson