Florida B.E.S.T. MA.7.DP.1
B.E.S.T. Standard (Benchmark Cluster)
Represent and interpret numerical and categorical data.
Florida B.E.S.T. Standards for Mathematics
Cluster contents
Benchmarks in This Standard
MA.7.DP.1 is a B.E.S.T. standard. These are the benchmarks under it.
- MA.7.DP.1.1
Determine an appropriate measure of center or measure of variation to summarize numerical data, represented numerically or graphically, taking into consideratio...
- MA.7.DP.1.2
Given two numerical or graphical representations of data, use the measure(s) of center and measure(s) of variability to make comparisons, interpret results and ...
- MA.7.DP.1.3
Given categorical data from a random sample, use proportional relationships to make predictions about a population.
- MA.7.DP.1.4
Use proportional reasoning to construct, display and interpret data in circle graphs.
- MA.7.DP.1.5
Given a real-world numerical or categorical data set, choose and create an appropriate graphical representation.
Teacher's field guide
What This Cluster Means
What Students Need to Do
- Students sort data by type, then choose an appropriate table or graph. They read displays to compare groups and describe patterns using counts, percentages, center, and spread.
What Mastery Looks Like
- A student can create an accurate bar graph for categorical data and a dot plot, histogram, or box plot for numerical data. They support comparisons with values read or calculated from the display.
Common Misconceptions
- Students may graph category labels on a number line, treat numerical values as categories, or use unequal intervals. They often compare only the highest values and ignore sample size, center, spread, or outliers.
How to Assess It
- Exit ticket: Provide snack choices [fruit, chips, fruit, crackers, chips, fruit] and study minutes [20, 35, 15, 40, 30, 25]. Students make one suitable display for each variable and write one conclusion supported by each display.
Lesson moves
Ways to Teach It
Give pairs sticky notes with shoe sizes and favorite lunch choices; students sort each variable and build a wall display suited to its type.
Show a bar graph and histogram, then ask students to explain why switching the graph types would make each dataset harder to read.
Run a graph-match relay where teams pair data tables with bar graphs, dot plots, histograms, or box plots and justify every match.
Use cafeteria survey results and daily wait times to compare menu preferences and service patterns, then propose one evidence-based change.
Free download
Printable MA.7.DP.1 Worksheet
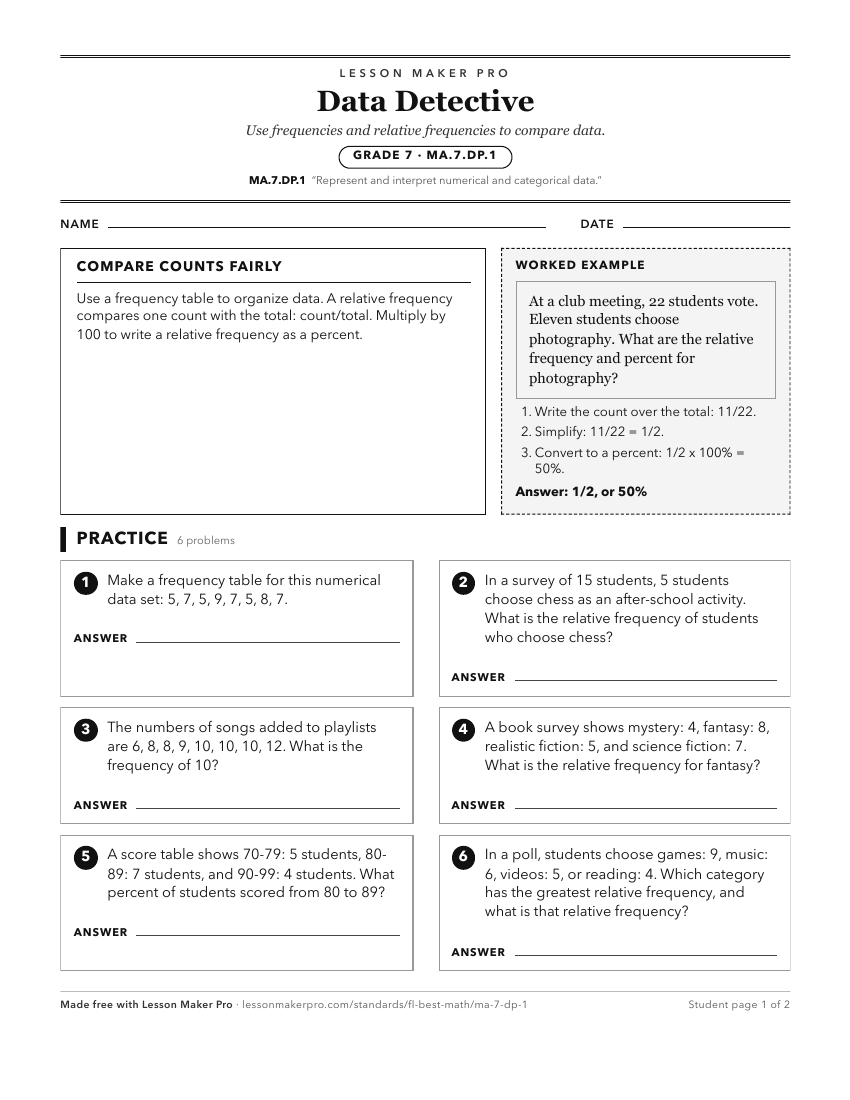
A ready-to-print activity worksheet aligned to MA.7.DP.1, with an answer key for the teacher on its own page. No account needed.
PDF, US Letter, prints cleanly in black and white.
Download the worksheetKeep exploring
Related Standards
- MA.8.DP.1
Represent and investigate numerical bivariate data.
- MA.912.DP.1.2
Interpret data distributions represented in various ways. State whether the data is numerical or categorical, whether it is univariate or bivariate and interpre...
- MA.912.DP.1
Summarize, represent and interpret categorical and numerical data with one and two variables.
- MA.3.DP.1
Collect, represent and interpret numerical and categorical data.
Turn this cluster into a lesson
Grade, subject, topic, and the complete cluster are prefilled. Create one free, no account needed.
Also for this cluster:Make a WorksheetMake a QuizMake a Sub Lesson