Florida B.E.S.T. MA.7.DP.1.4
The Standard
Use proportional reasoning to construct, display and interpret data in circle graphs.
Florida B.E.S.T. Standards for Mathematics
Teacher's field guide
What This Standard Means
What Students Need to Do
- Students convert category counts into fractions, percentages, and sector angles. They create accurate circle graphs and use the slices to compare categories and answer questions.
What Mastery Looks Like
- A student can convert each category count into a percentage and an angle out of 360°. The graph has proportional slices and clear labels, with percentages totaling 100% and angles totaling 360°.
Common Misconceptions
- Students may divide by the wrong total or treat raw counts as percentages. They may draw angles inaccurately, forget the sectors total 360°, or call the largest slice a majority when it is below 50%.
How to Assess It
- Give students pet-choice counts: dogs 10, cats 6, other 4. Ask them to calculate each percentage and sector angle, sketch the graph, and identify the category representing 30%.
Lesson moves
Ways to Teach It
Give pairs a paper plate, protractor, and data table; they calculate sector angles, draw each slice, and label percentages.
Ask students which category is most common and how the slice proves it, then require a two-sentence answer using percentages.
Run a card match with category counts, equivalent percentages, sector angles, and circle graph slices from the same data set.
Survey students' preferred lunch options, tally results, and create a circle graph for a mock cafeteria menu report.
Free download
Printable MA.7.DP.1.4 Worksheet
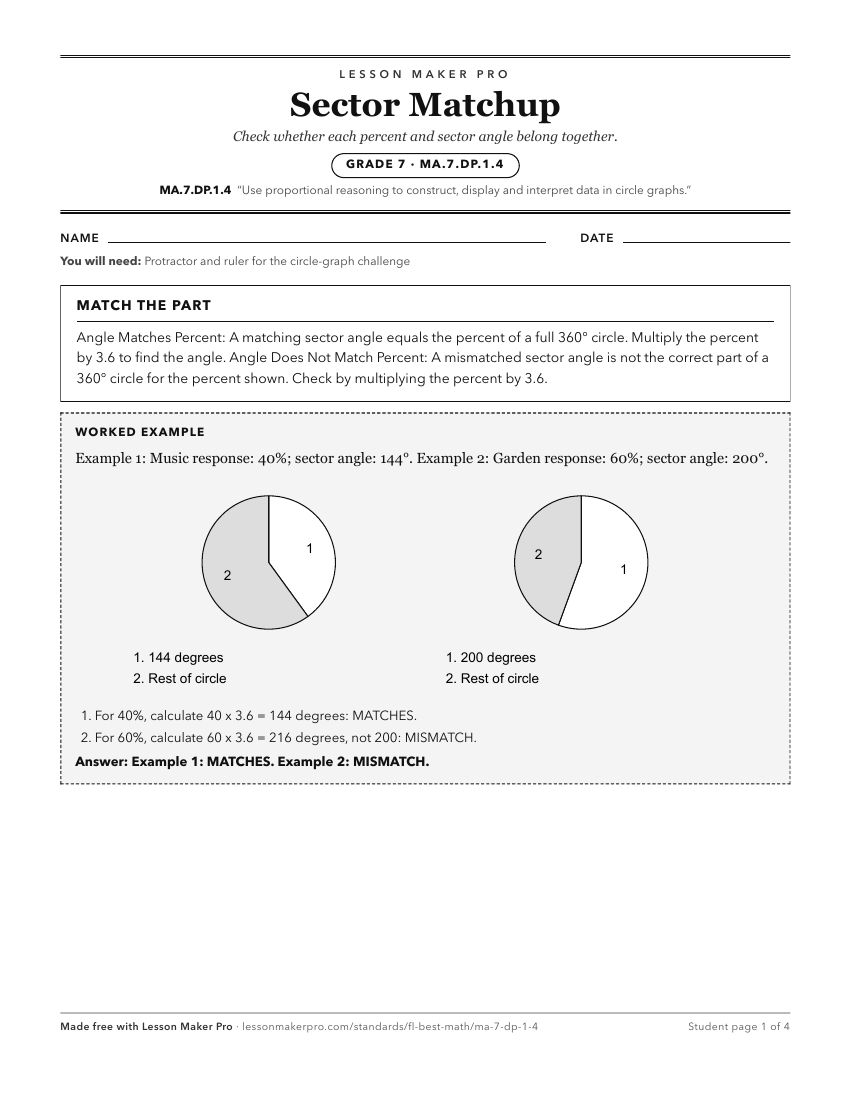
A ready-to-print activity worksheet aligned to MA.7.DP.1.4, with an answer key for the teacher on its own page. No account needed.
PDF, US Letter, prints cleanly in black and white.
Download the worksheetKeep exploring
Related Standards
- MA.3.DP.1.2
Interpret data with whole-number values represented with tables, scaled pictographs, circle graphs, scaled bar graphs or line plots by solving one- and two-step...
- MA.7.AR.3
Use percentages and proportional reasoning to solve problems.
- MA.5.DP.1.1
Collect and represent numerical data, including fractional and decimal values, using tables, line graphs or line plots.
- MA.3.DP.1.1
Collect and represent numerical and categorical data with whole-number values using tables, scaled pictographs, scaled bar graphs or line plots. Use appropriate...
Turn this exact standard into a lesson
Grade, subject, topic, and the complete standard are prefilled. Create one free, no account needed.
Also for this standard:Make a WorksheetMake a QuizMake a Sub Lesson