Florida B.E.S.T. MA.912.DP.1.2
The Standard
Interpret data distributions represented in various ways. State whether the data is numerical or categorical, whether it is univariate or bivariate and interpret the different components and quantities in the display.
Florida B.E.S.T. Standards for Mathematics
Teacher's field guide
What This Standard Means
What Students Need to Do
- Students identify each variable in a data display and classify it as numerical or categorical. They decide whether the data is univariate or bivariate, then explain frequencies, percentages, center, spread, clusters, gaps, or associations when appropriate.
What Mastery Looks Like
- Given a histogram, box plot, dot plot, bar graph, two-way table, or scatter plot, students correctly identify the variable types and number of variables. They use labels, scales, counts, percentages, and visible patterns to make accurate statements in context.
Common Misconceptions
- Students may treat number labels, such as ZIP codes, as numerical data even though they name categories. They may call data bivariate because a graph has two axes or compares two groups, rather than checking whether two variables were measured. They may read bar height without checking the scale, units, or whether it represents a count, percent, or interval.
How to Assess It
- Show a scatter plot of hours studied and test scores for 20 students. Ask: "Name each variable type, classify the data as univariate or bivariate, and write two observations supported by the graph."
Lesson moves
Ways to Teach It
Give groups cards showing histograms, bar graphs, box plots, scatter plots, and two-way tables, then have them sort by variable type and number.
Project a graph and ask, "What does each axis represent, what does each mark show, and which claims are supported?"
Run a matching game in which students pair each display with its variable classification and one supported interpretation.
Use a school attendance dashboard to identify variable types, determine whether data is univariate or bivariate, and explain one visible pattern.
Free download
Printable MA.912.DP.1.2 Worksheet
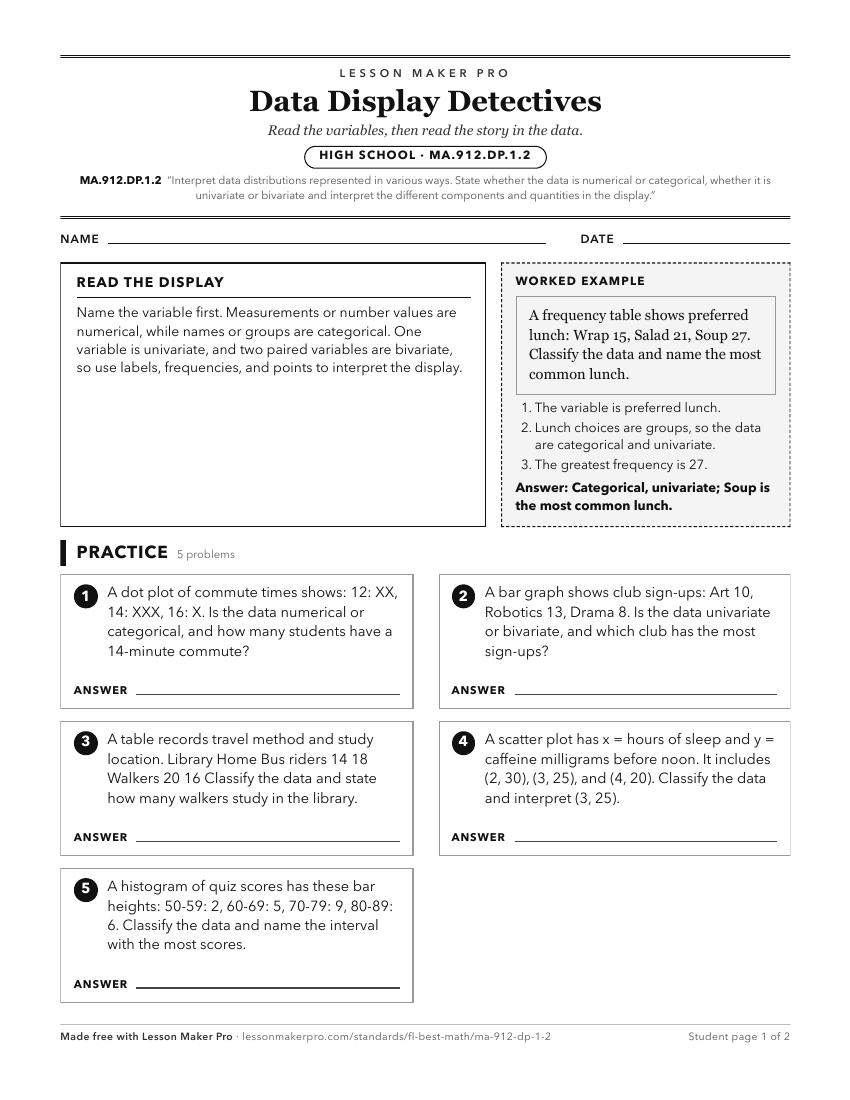
A ready-to-print activity worksheet aligned to MA.912.DP.1.2, with an answer key for the teacher on its own page. No account needed.
PDF, US Letter, prints cleanly in black and white.
Download the worksheetKeep exploring
Related Standards
- MA.912.DP.1.1
Given a set of data, select an appropriate method to represent the data, depending on whether it is numerical or categorical data and on whether it is univariat...
- MA.912.DP.1
Summarize, represent and interpret categorical and numerical data with one and two variables.
- MA.3.DP.1
Collect, represent and interpret numerical and categorical data.
- MA.7.DP.1
Represent and interpret numerical and categorical data.
Turn this exact standard into a lesson
Grade, subject, topic, and the complete standard are prefilled. Create one free, no account needed.
Also for this standard:Make a WorksheetMake a QuizMake a Sub Lesson